Figures & data
Figure 1. Map showing location of Iran and the location of the investigated weather stations, Anzali and Astara.
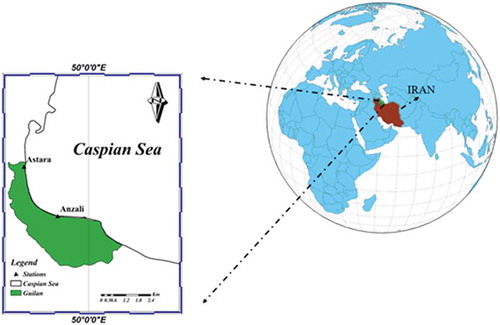
Table 1. Basic statistics of meteorological variables for Anzali station. SD: standard deviation; T: temperature; RH: relative humidity.
Table 2. Basic statistics of meteorological variables for Astara station.
Table 3. Gamma test results showing the relative importance of input meteorological variables. Bold indicates best fit. WS: wind speed; SH: sunshine hours; γ: gamma value.
Table 4. Optimal values of MLP, SVM and MLP-KH parameters for Anzali and Astara weather stations.
Table 5. Statistical performance indicators for the MLP, SVM and MLP-KH models over the testing phase.
Figure 2. Observed daily pan evaporation versus estimates produced by MLP, SVM and MLP-KH models over the testing phase: (a) Anzali station and (b) Astara station.
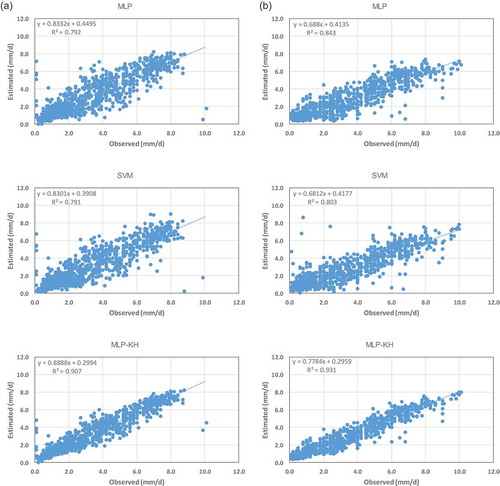
Figure 3. (a) Taylor diagram, (b) violin plot and (c) point density distribution to compare MLP, SVM and MLP-KH models with respect to the observed daily pan evaporation over the testing phase – Anzali weather station.
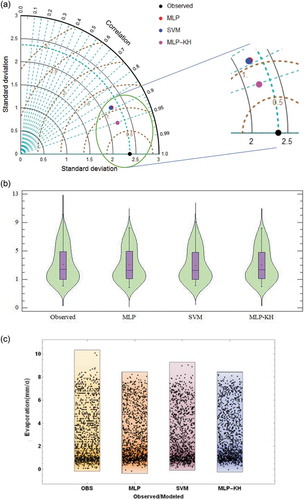
Figure 4. (a) Taylor diagram, (b) violin plot and (c) point density distribution to compare MLP, SVM and MLP-KH models with respect to the observed daily pan evaporation over the testing phase – Astara weather station.
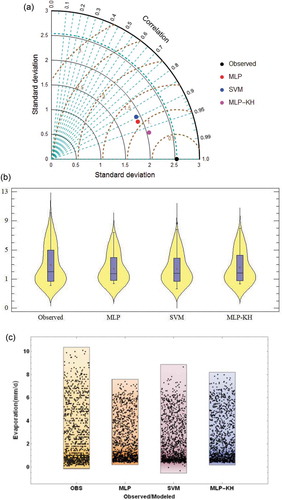
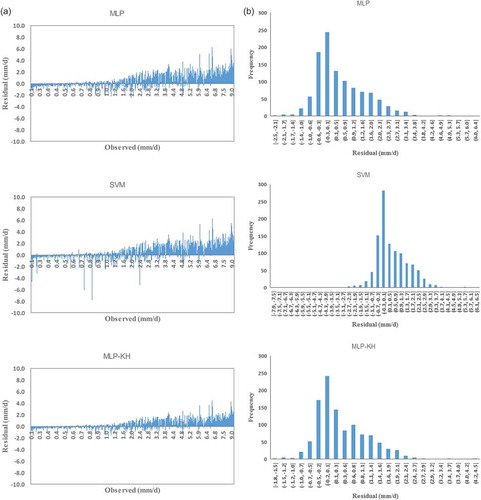
Figure 5. (a) Residuals and (b) their distribution for MLP, SVM and MLP-KH models in estimating daily pan evaporation over the testing phase – Anzali weather station.
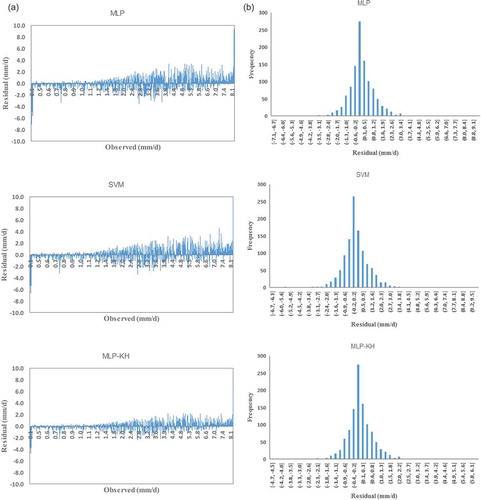
Figure 6. (a) Residuals and (b) their distribution for MLP, SVM and MLP-KH models in estimating daily pan evaporation over the testing phase – Astara weather station.