Figures & data
Figure 1. Representation of the four myths of nature (or rationalities) according to their main features and their view of nature (after Thompson et al. Citation1990). (a) risk neglecting; (b) risk controlling; (c) risk downplaying and (d) risk monitoring.
Table 1. Parameters of the socio-hydrological model used in the analysis. The values varying in a range depend on each specific society (see ).
Table 2. Parameters of the socio-hydrological model, which vary depending on each ideal type of society.
Figure 2. Outcomes of the socio-hydrological model for each stylized society, (a) risk neglecting, (b) risk controlling, (c) risk downplaying and (d) risk monitoring, in terms of (1) levee construction, (2) social memory of flood event, (3) population density in the floodplain and (4) flood losses.
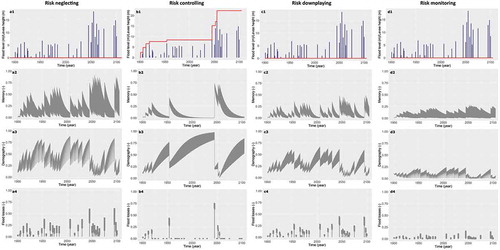
Figure 3. Sum of flood losses corresponding to the highest level of preparedness/awareness (i.e. highest αD value) for each society.