Figures & data
Figure 1. Location of water temperature monitoring sites in Catamaran Brook (CatBk), Tributary 1 (Trib 1) and Little Southwest Miramichi River (LSWM).
Figure 2. Different models of water temperature sensors used in the present study: (a) HOBO Pendant (±0.5°C), (b) Vemco Minilog II (±0.1°C) and (c) HOBO TidbiT (±0.2°C).
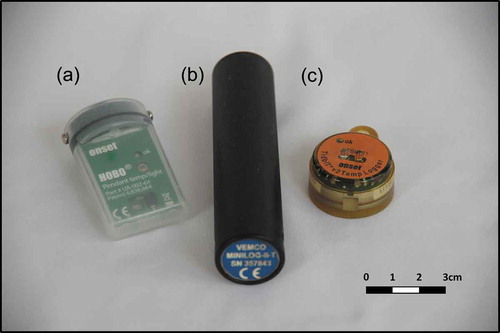
Figure 3. Water temperatures during the calibration period (5–13 July 2017): (a) differences between each sensor and the mean water temperature of Vemco Minilogs (17.93°C); (b) relative error of all adjusted sensors compared to Sensor 5 (see text for details).
Figure 4. Mean hourly water temperatures at each site for sensors under shielded conditions (protected against direct solar radiation heating) during the study period (14 July–20 August 2017; 38 days).
Figure 5. Mean water temperatures during the study period for various sensor models (Vemco Minilog, HOBO TidbiT and HOBO Pendant) and for both shielded and open conditions. Values on top of bars represent the standard deviation (SD).
Figure 6. Boxplot of hourly temperature differences for selected sensors under open conditions (difference = temperature of sensor – average temperature of shielded sensors).
Figure 7. Boxplot of temperature differences at open sites when calculating minimum and maximum daily water temperatures (difference = open site temperature – average temperature of shielded sites).