Figures & data
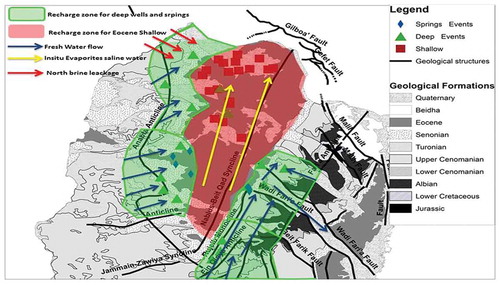
Figure 1. Geological map of the study area showing different geological structures, units and locations of sampled wells, and deep and shallow springs.
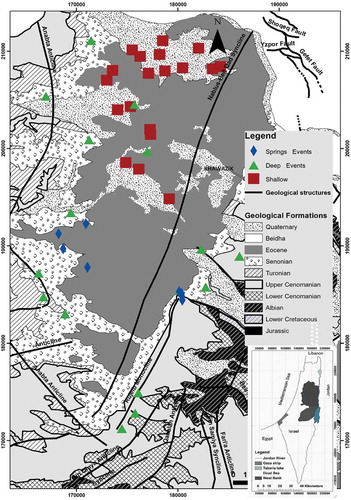
Table 1. Generalized stratigraphic column of the West Bank (modified after Braun and Hirsch Citation1994, Guttman and Zuckerman Citation1995).
Table 2. Hydrochemistry and isotope data for the groundwater samples from different sub-aquifers in the North-eastern Basin.
Figure 2. Piper diagram showing different chemical behaviours and water types between springs, and shallow and deep wells, which vary between CaCO3 freshwater in the springs to NaCl-dominated brackish water in the Eocene shallow wells.
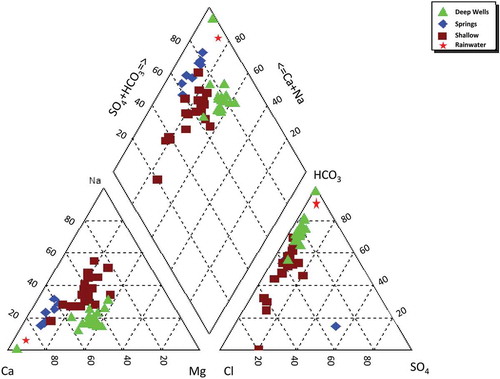
Figure 3. Major anions, cations and δ18O[SMOW] vs Cl− (meq/L) in the groundwater samples show an increase in salinity from south to northeast, according to the spatial distributions of the sampled points. In particular, Na+ concentrations show conservative behaviour, with Cl− indicating a 1:1 relation, while SO42+ concentrations also show a positive relationship with respect to Cl−.
![Figure 3. Major anions, cations and δ18O[SMOW] vs Cl− (meq/L) in the groundwater samples show an increase in salinity from south to northeast, according to the spatial distributions of the sampled points. In particular, Na+ concentrations show conservative behaviour, with Cl− indicating a 1:1 relation, while SO42+ concentrations also show a positive relationship with respect to Cl−.](/cms/asset/8d6b3c1d-e527-4eda-bbbb-2af584ec7d6b/thsj_a_1703187_f0003_oc.jpg)
Figure 4. Mg + Ca vs SO4 + HCO3 in meq/L, showing the evaporitic salinity trend in the study area, low salinity for the springs and deep wells in the southwest and scattered anion content due to dissolution of sediments in the northwest.
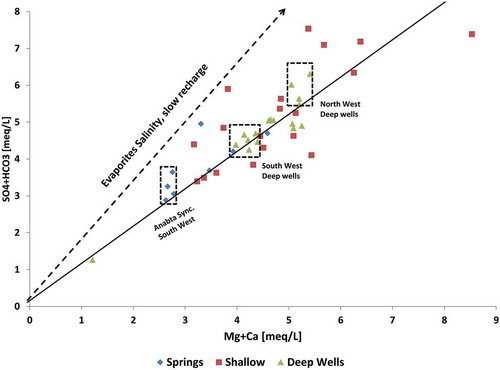
Figure 5. The ratio of Mg/Cl vs Ca/Cl in meq/L differentiates three groups with different chloride contents and distinct Mg/Ca molar ratios: (a) direct quick recharge for the springs from Jerusalem (Turonian); (b) groundwater in the shallow Eocene with high evaporitic salinity and slow recharge; (c) deep wells group with variable Mg content from Lower Cretaceous.
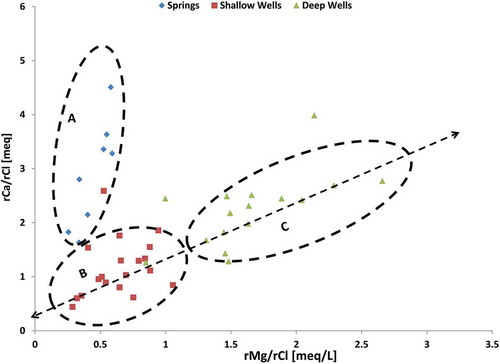
Figure 6. δD vs δ18O[SMOW] for local rainwater accounting for the local meteoric water line (LMWL) and for the sampled groundwater, which exhibit almost meteoric water signatures for the springs and enriched δ18O signatures for the deep and shallow wells due to evaporation.
![Figure 6. δD vs δ18O[SMOW] for local rainwater accounting for the local meteoric water line (LMWL) and for the sampled groundwater, which exhibit almost meteoric water signatures for the springs and enriched δ18O signatures for the deep and shallow wells due to evaporation.](/cms/asset/dfd72f4d-fd4d-4581-b7ec-d9847560c79b/thsj_a_1703187_f0006_oc.jpg)
Figure 7. δ13CDIC [VPDB] vs δO18 [SMOW] values, indicating higher freshwater values in the springs and deep wells in the south. In contrast, shallow wells in the north reveal δ18O enrichment parallel to enrichment of δ13CDIC. The results were compared with the δ13CDIC signatures from the alluvial aquifer in the Jericho area (Khayat et al. Citation2010).
![Figure 7. δ13CDIC [VPDB] vs δO18 [SMOW] values, indicating higher freshwater values in the springs and deep wells in the south. In contrast, shallow wells in the north reveal δ18O enrichment parallel to enrichment of δ13CDIC. The results were compared with the δ13CDIC signatures from the alluvial aquifer in the Jericho area (Khayat et al. Citation2010).](/cms/asset/e4a6518d-b41e-4eca-bd48-0d1daec62b33/thsj_a_1703187_f0007_oc.jpg)
Figure 8. Seasonal distributions of δ18O signatures (in ‰ V-SMOW; a and b) and chloride content (in meq/L; c and d) for the deep wells, which show less depletion response for the Eocene sub-aquifer in the north, while more depleted signatures are noticed surrounding the flanks of both anticlines and in the south of the study area.
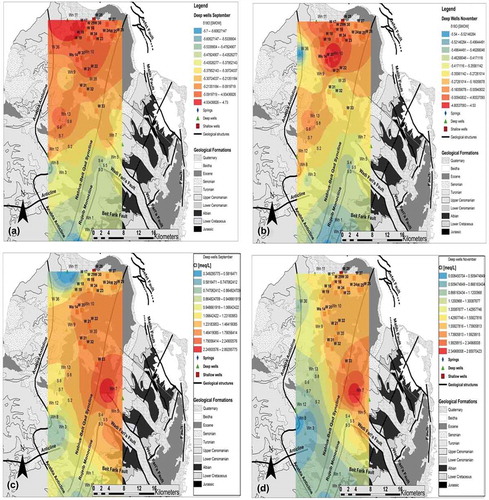
Figure 9. Conceptual recharge and flow model for different aquifer system in the study area, showing different potential recharge zones and groundwater flow from different zones.