Figures & data
Figure 1. Human domination of Earth systems presents global land and water managers with numerous challenges, which include phenomena that are inconvenient truths vis-a-vis the local politics, social norms, or perceived national security interests. Where pursuit of sustainable environmental governance has deteriorated, responsibility for environmental degradation may be mistakenly assigned to climatic drivers to fulfill expedient objectives by exploiting any number of vehicles. Several exemplars of climatization have become apparent within different domains and contexts. Each exemplar may implicate a particular subset of climatic processes with numerous consequences from both sociopolitical and scientific perspectives. The credibility of Earth sciences demands that scientists vigorously confront climatization.
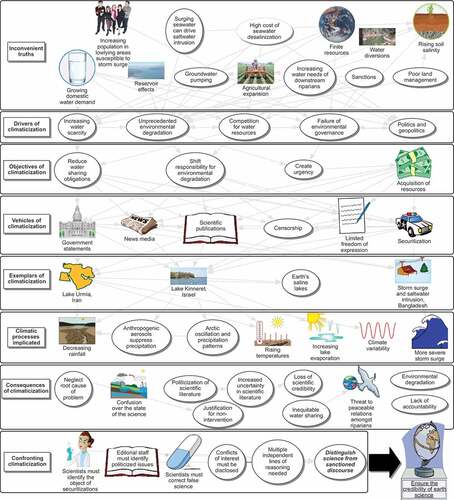
Figure 2. The majority of Earth’s human population resides in states classified by Freedom in the World as either not free or only partially free. Even among certain states categorized as free, water resource securitizations have been reported. Degree of freedom is from Freedom in the World 2018 compiled by Freedom House.
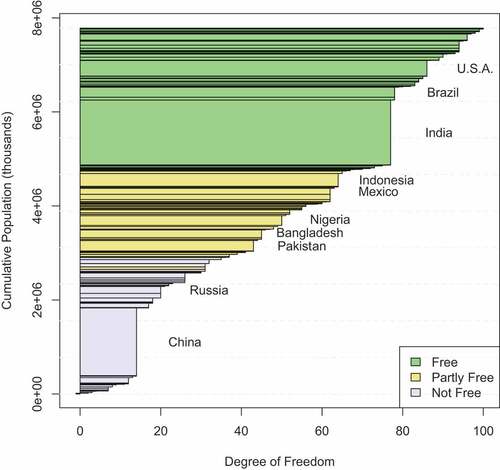
Table 1. Reported securitizations.
Figure 3. As Earth has warmed, the mean annual water level in the Great Salt Lake has decreased (1880–2018). However, while warming can increase open water evaporation, this inverse relationship largely reflects a spurious correlation. The primary driver of the Great Salt Lake’s shrinkage is increasing human water consumption, with the role of rising temperatures being of lesser importance by an order of magnitude (Wurtsbaugh et al. Citation2017, Wine et al. Citation2019a).
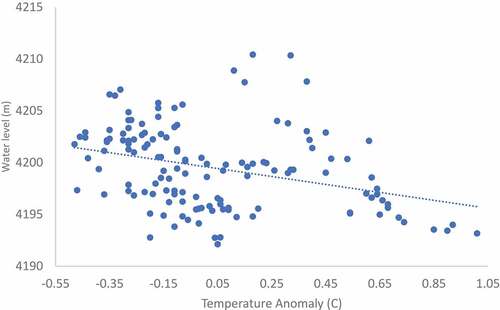
Figure 4. As agricultural water consumption increased in Lake Urmia’s basin the lake shrank from its historical extent due to a persistent negative water balance. Irrigated agricultural areas are from Meier et al. (Citation2018); historical lake extent, Lehner and Döll (Citation2004); watershed area (Lehner and Grill Citation2013); and current surface water extent from Landsat Normalized Difference Vegetation Index (NDVI) subject to the threshold of NDVI<-0.1.
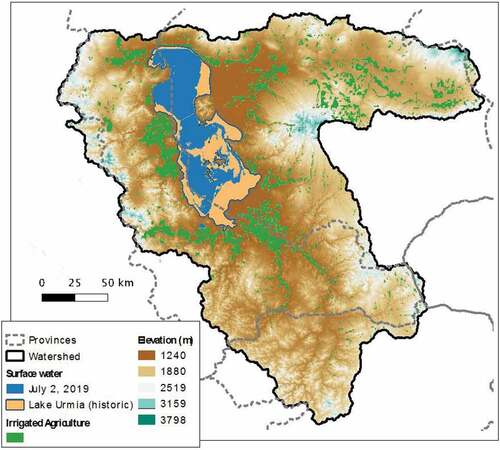
Figure 5. Change in precipitation (%) in the future (2010–2099) relative to a baseline period (1971–2000) under RCP8.5 (top left) and RCP2.6 (top right). The red bars represent the projections of the five GCMs selected by Shadkam et al. (Citation2016b) and their ensemble mean, and the blue bars represent the projections of five other GCMs and their ensemble mean. Similar figures are provided for different projection periods (2010–2039, 2040–2069, and 2070–2099) consistent with Shadkam et al. (Citation2016b). The figure highlights that robust projections require consideration of a wide range of possible future climatic conditions.
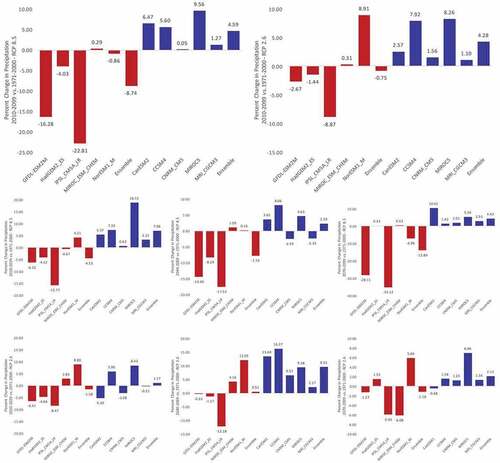
Figure 6. In the transboundary Jordan River basin, hydrologic science determines how water availability and quality will change under climatic non-stationarity. However, securitization of these transboundary water resources has manifested when a securitizing state actor enforces data secrecy (Wine Citation2019e) that obscures the relative roles of endogenous versus exogenous drivers (Wine Citation2019b). By obfuscating hydrologic process understanding in a transboundary basin, an upstream riparian may increase water consumption or impact water quality while falsely assigning to climatic factors responsibility for water scarcity or degraded water quality (Wine Citation2019a).
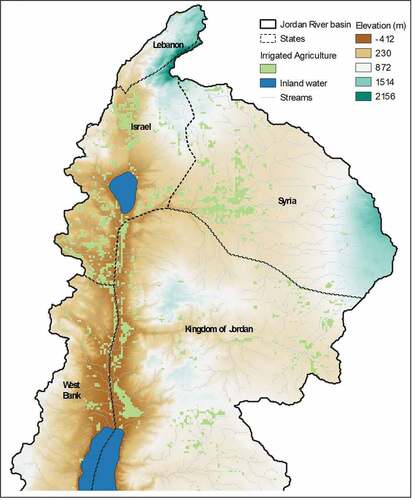
Figure 7. Despite the presence of irrigated agriculture in Lake Hulun’s watershed, its contribution to the lake’s negative water balance has neither been included in conceptual models of the lake’s water balance nor quantified.
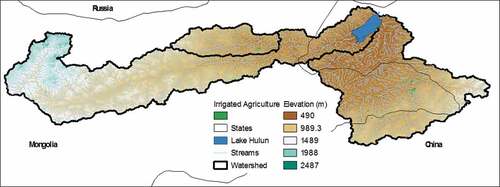
Table 2. State variables in socio-hydrology (Sivapalan et al. Citation2012, Citation2014, Sivapalan Citation2015, Di Baldassarre et al. Citation2015, Loucks Citation2015, Gober and Wheater Citation2015, Troy et al. Citation2015a, Citation2015b, Tian et al. Citation2019).
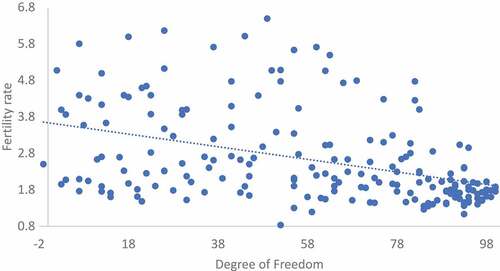
Figure 8. With increasing freedom progress toward a sustainable human population is achieved (Campbell et al. Citation2013, Warren Citation2015, Citation2016). Degree of freedom is from the 2018 Freedom in the World Index compiled by Freedom House. Fertility Rate is from the World Fact Book, estimated for 2018.