
Figures & data
Table 1. Table of SWAT model parameters (modified from Guse et al. Citation2017). Lower and upper ranges are given as absolute range (r), additive (a) or multiplicative (m) values. For further information we refer to the theoretical documentation of the SWAT model (Neitsch et al. Citation2011).
Figure 1. Parameter identifiability plot as density function for twelve SWAT model parameters for the Treene catchment computed for the calibration period (2000–2005). Different statistical metrics (above) and signature measures (below) are used to select behavioural parameter sets. The model parameter names are coloured according to the different hydrological processes.
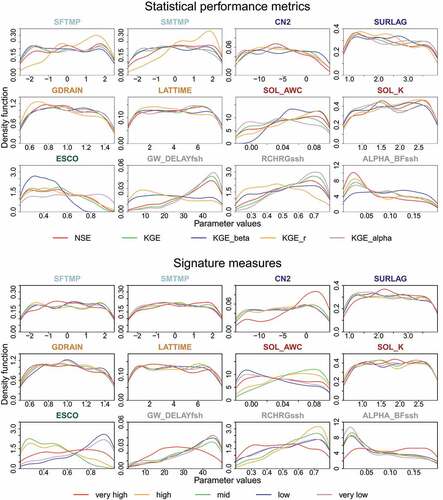
Figure 2. Presentation of appropriate parameter values for twelve model parameters in the three catchments using the initial parameter ranges. Appropriate parameter ranges are calculated for 10 different performance criteria. The colour gradient ranges from yellow (inappropriate parameter values) via green to blue (appropriate parameter values). The colour bar for each subplot is defined by setting the blue colour to the maximum value among all performance criteria. A greater colour contrast indicates a high parameter identifiability, while a low contrast indicates low identifiability. The model parameter names are coloured according to the different hydrological processes.
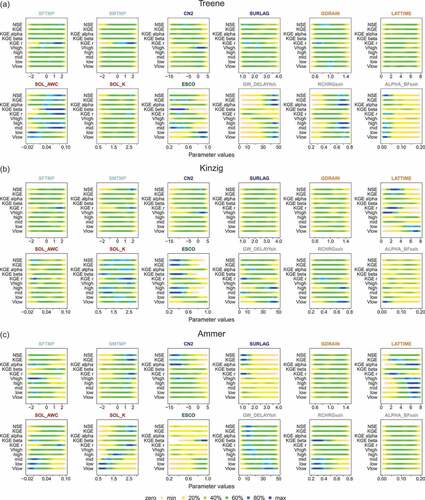
Table 2. Parameter constraints in the three catchments. The reduction of the parameter range is presented in %. 0% means that the parameter is not changed, × means that the parameter is not considered in LHconstrain and its initial value is kept. The constrained parameter ranges are denoted in brackets (min, max).
Figure 3. Reduction of parameter ranges in % for model simulations in the different rounds of parameter constraints. A reduction of 100% means that the parameter was removed from the parameter sampling after the initial simulation round due to a low relevance.
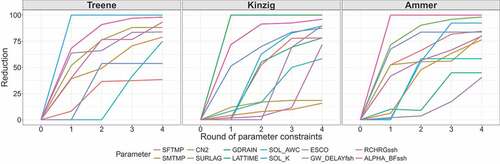
Figure 4. Presentation of appropriate parameter values for twelve model parameters in the three catchments using final constrained parameter ranges. See for explanation. [Colour figure available in online version only.].
![Figure 4. Presentation of appropriate parameter values for twelve model parameters in the three catchments using final constrained parameter ranges. See Fig. 2 for explanation. [Colour figure available in online version only.].](/cms/asset/99894c6d-180a-4579-8039-befee57ff6fc/thsj_a_1734204_f0004_oc.jpg)
Figure 5. Optimum parameter values for the 10 performance criteria separately for each catchment as detected in the simulation with the final constrained parameter ranges. The x-axes are adapted to the optimum parameter values and do not represent the full parameter range.
Figure 6. Comparison of performance criteria between model simulations based on initial Latin hypercube sampling (IC: calibration and IV: validation period) and step-wise rounds of constrained parameter ranges (C1–C4: calibration and V1–V1: validation) for all three catchments for the validation period. The different simulation rounds are shaded in grey. The horizontal black line shows optimal value of performance criteria.
Figure 7. Changes in median in the values of performance criteria for the 2000 model simulations of LHinitial and the final simulations of LHconstrain for the calibration and validation period. Please note that the optimal values vary between the performance criteria. The black horizontal line shows the optimal value of the performance criteria. Tr: Treene; Ki: Kinzig; Am: Ammer; followed by C for calibration and V for validation.
Figure 8. Comparison of simulated discharge time series using the model simulations with the initial parameter ranges (LHinitial) and the final parameter constraints (LHconstrain) with the observed discharge time series. For both simulations, the 5% and 95% of the 2000 simulations are shown in separate subplots for the three catchments.
Figure 9. Average minimum Euclidean distances among parameter sets in the parameter space. Each catchment is shown in different colours. Tr: Treene; Ki: Kinzig; Am: Ammer. The number denotes the rounds of parameter constraints.
Table 3. Relationship of performance criteria, part of hydrograph, hydrological components and SWAT model parameters.