Figures & data
Figure 1. Differences between variables, indicators and index. Source: Pedro-Monzonís (Citation2016).
Figure 2. Location of the Guadiana River Basin in the Iberian Peninsula.
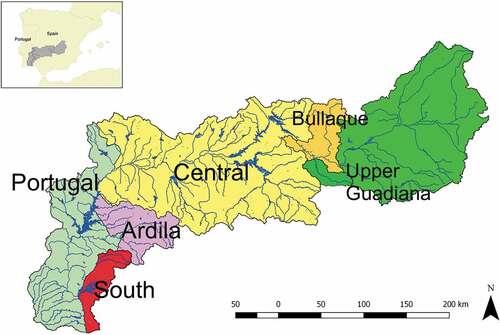
Figure 3. Conceptual model within socio-hydrology using the pluralistic water research framework of Evers et al. (Citation2017). Steps of the methodology are numbered as follows: 1 – selection of the water demand reliability indicators; 2 – modelling of the Guadiana River Basin system with the AQUATOOL decision support system; and 3 – comparison of the behaviour of the indicators using the proposed dataset.
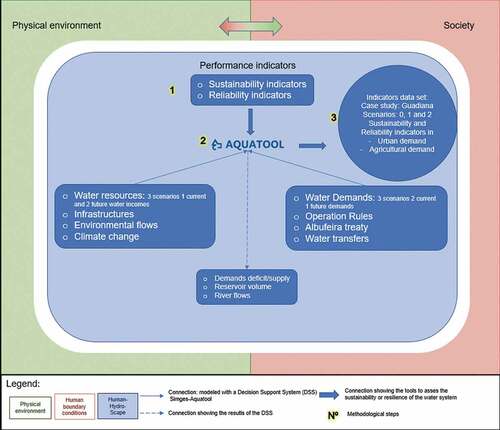
Table 1. Details of the water demand performance indicators used in the methodology. RI: reliability indicators; SI: sustainability indicators.
Figure 4. Water allocation model of Guadiana River Basin with the AQUATOOL-SIMGES graphical interface.
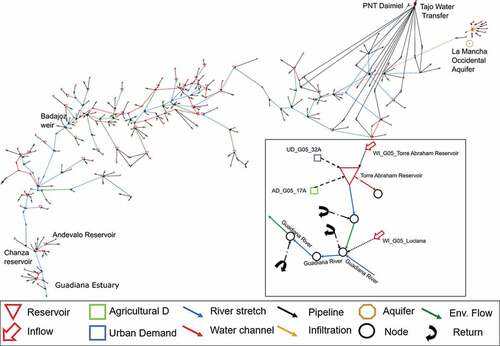
Table 2. AQUATOOL-SIMGES model characteristics of the GRB by sub-basin. Average annual values in hm3. Data used in the reference scenario series 1980/81–2011/12. Sub-basins: 1 – Upper Guadiana; 2 – Bullaque; 3 – Central; 4 – Ardila; 5 – South; 6 – Portugal.
Table 3. Summary of the differences between scenarios 1 and 2 in the water allocation model. Values in hm3/year. UD: urban demand, AD: agricultural demand. Sub-basins: 1: Upper Guadiana; 2: Bullaque; 3: Central; 4: Ardila; 5: South; 6: Portugal.
Table 4. Results of sustainability and reliability indicators and indices for urban demands with deficit values in the temporal series under Scenario 0.
Figure 5. Comparison between the reliability indicator (Rel) and the monthly failure indicator (MF) for those urban demands (UD) that fail in the model under Scenario 0.
Figure 6. Comparison between the resilience indicator (Res) and the annual failure indicator (AF) for the urban demands (UD) that fail in the model under Scenario 0.
Table 5. Results of sustainability and reliability indicators and indices for agricultural demands with deficit values in the temporal series under Scenario 0.
Figure 7. Comparison between the sustainability indicators (SIs) and the A and B indicators for the reliability of the agricultural demands (AD) that fail in the model under Scenario 0.
Figure 8. Comparison between the sustainability index (SusInd) and the agricultural demands reliability index (ADRIx) for the agricultural demands (AD) that fail in the model under Scenario 0.
Figure 9. Results (in %) of the sustainability index by group under the different scenarios: (a) urban demands and (b) agricultural demands.
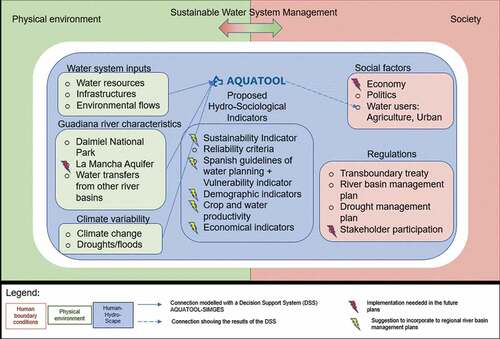
Figure 10. Conceptual model with our suggestions to the Spanish authorities within the socio-hydrological framework based on Evers et al. (Citation2017).