Figures & data
Figure 1. Workflow of the proposed method.
Table 1. Statistical characteristics of the input and output data.
Figure 2. Location of Sira station on the Karaj River in Iran.
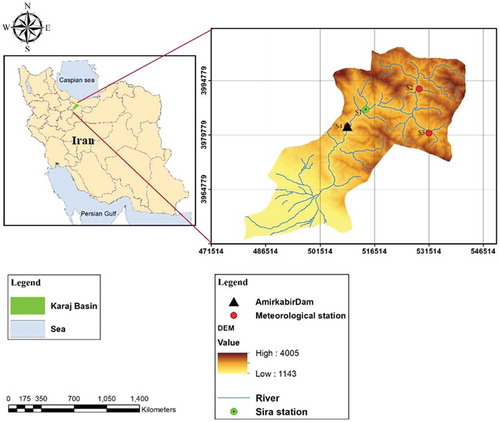
Figure 3. Observed monthly streamflow at Sira station on Karaj River for the period 1988–2012.
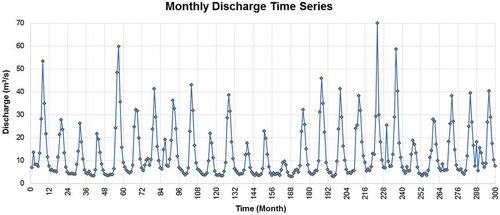
Table 2. Original and generated features in the study area. See for abbreviations of stations.
Table 3. Values of the parameters used for the PSO algorithm.
Table 4. Selected features by feature selection method.
Table 5. Values of the parameters used for the GOA.
Table 6. Statistical performance evaluation of the applied models in the testing phase. R2: determination coefficient; MAE: mean absolute error; RMSE: root mean squared error; NS: Nash-Sutcliffe efficiency criterion.
Table 7. Number of support vectors and optimal parameters obtained for SVR.
Figure 4. Observed vs simulated streamflow (m3 s−1) using various models on the test data: (a) LASSO and Morlet wavelet, (b) LASSO and Mexican hat wavelet, (c) PSO-ANN and Morlet wavelet and (d) PSO-ANN and Mexican hat wavelet.
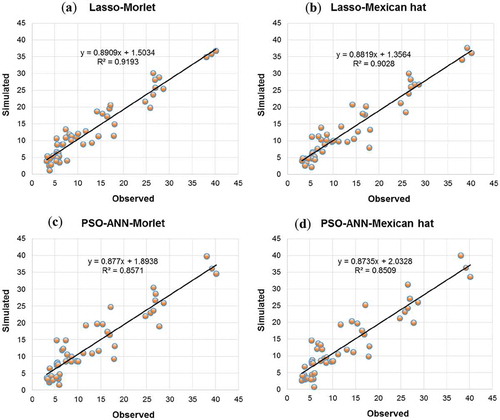
Figure 5. Observed vs simulated streamflow (m3 s−1) using the Lasso-Morlet model as the most accurate model with (a) original features and (b) original features and one lagged discharge.
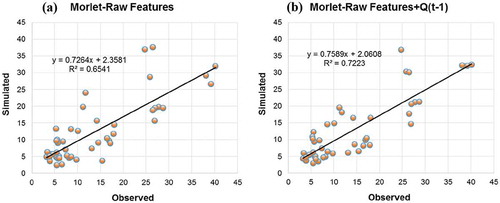
Figure 6. Observed vs simulated streamflow for the test data using the Lasso-Morlet model.
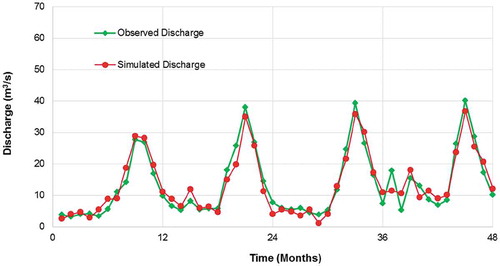
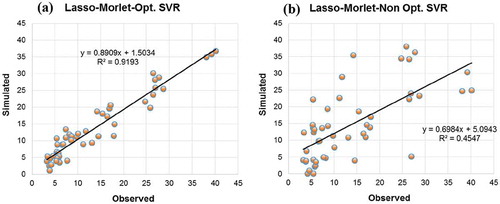
Figure 7. Observed vs. simulated streamflow (m3 s−1) using (a) LASSO-Morlet with optimized SVR parameters and (b) LASSO-Morlet with not optimized (pre-assumed) SVR parameters.