Figures & data
Figure 1. Overview map of the UK showing the case study catchments.
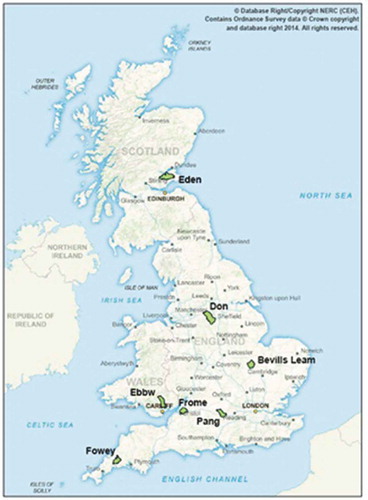
Table 1. Number of iterations and ranges of NSE for monthly percentiles.
Table 2. Key model parameter ranges and number of iterations.
Table 3. Model performance for the calibration and validation stages of the five catchments studied.
Figure 2. Ebbw River catchment – model calibration for the period 2000–2003.
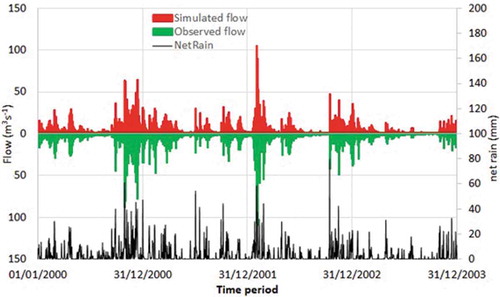
Table 4. Results of daily GLUE prediction bounds for all the studied catchments (See the Appendix for description of the parameters).
Table 5. Results of monthly GLUE prediction bounds for all the studied catchments.
Table 6. Results of seasonal GLUE prediction bounds for all the studied catchments.
Table 7. Results of annual GLUE prediction bounds for all the studied catchments.
Figure 3. Model output uncertainty boundaries (5th and 95th percentiles) when performing the GLUE analysis on model calibration (2000–2004) and validation (1961–2012) periods for the Ebbw catchment river flow (monthly values).
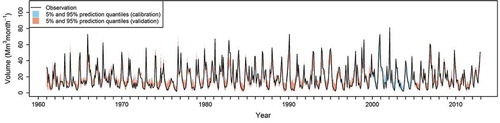
Figure 4. Model output uncertainty boundaries (5th and 95th percentiles) when performing the GLUE analysis on model calibration (2001–2012) and validation (1967–2012) periods for the Don catchment river flow (seasonal values).
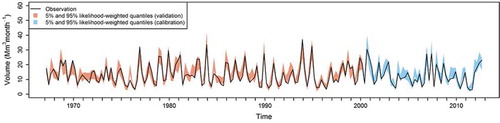
Figure 5. Model output uncertainty boundaries (5th and 95th percentiles) when performing the GLUE analysis on model calibration (2001–2012) and validation (1971–2000) periods for the Frome catchment using annual observed and simulated data.
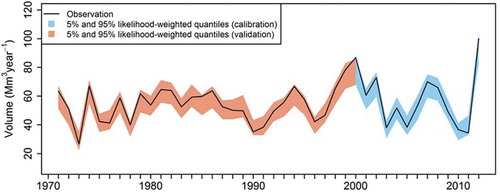
Figure 6. Uncertainty band of the DiCaSM parameters for the period 1962–2012 for the Don and Ebbw catchments. The solid (red) vertical line represents the average value of the measured river flow for the simulated period.
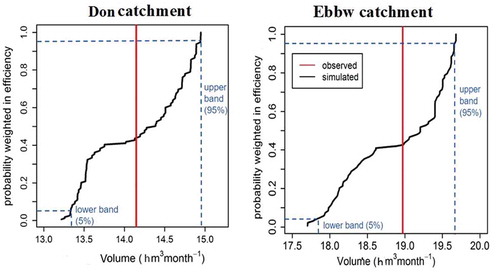
Figure 7. Cumulative probability plot of flows for the Don and Ebbw catchments (1962–2012).
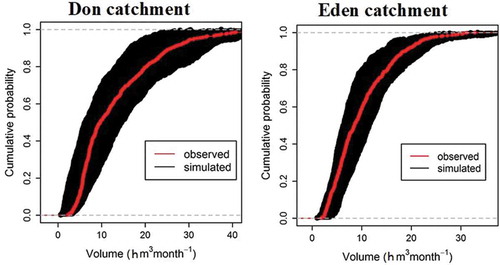
Figure 8. Containment ratio (CR) at different timescales for the Frome, Eden, Don and Ebbw catchments.
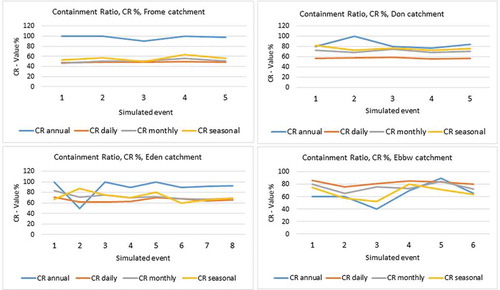
Figure 9. Asymmetric degree S for the Frome, Eden, Don and Ebbw catchments.
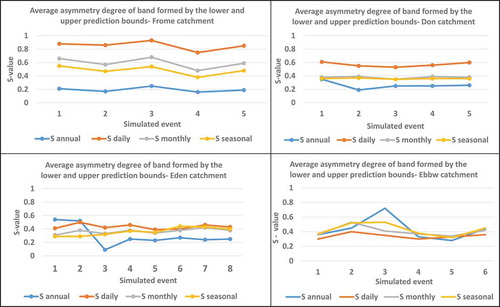
Figure 10. Asymmetric degree T for the Frome, Eden, Don and Ebbw catchments.
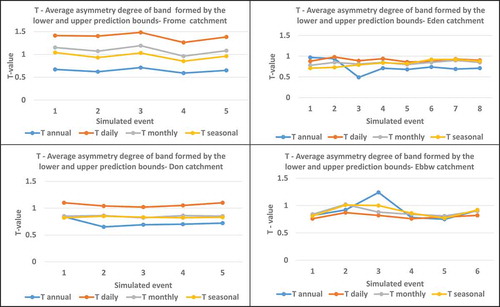
Figure 11. Average relative band width, RB, for the Frome, Eden, Don and Ebbw catchments.
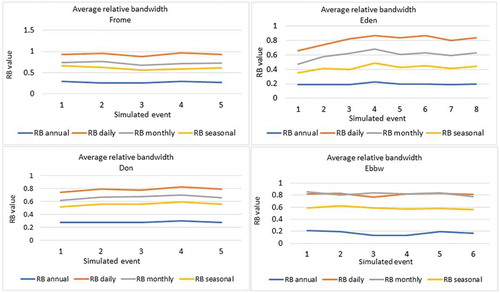
Figure 12. Average relative deviation, RD, for the Frome, Eden, Don and Ebbw catchments.
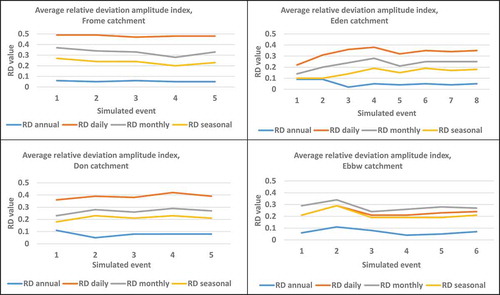
Figure 13. R factor values for the Frome, Eden, Don and Ebbw catchments.
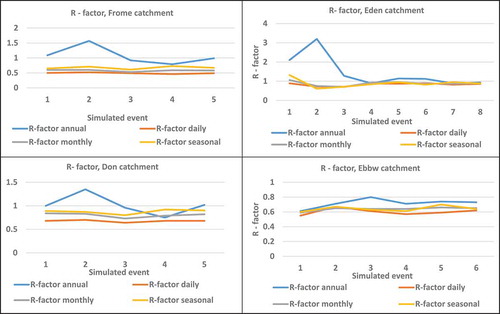
Figure A1. Flowchart for the uncertainty analysis procedure.