Figures & data
Table 1. Selected characteristics of the study catchments and climate stations.
Figure 1. Location of the study catchments. Catchment number 1 is used for the highest catchment (mean catchment elevation) and 7 refers to the lowest catchment.
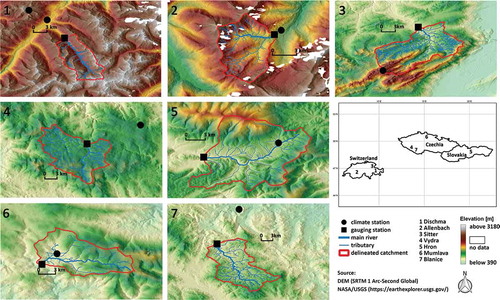
Table 2. Climate and hydrological variables.
Figure 2. Annual, seasonal and monthly Mann-Kendall trends for discharge, air temperature, precipitation and selected snow variables for the study period 1966–2012; monthly, seasonal (XI–IV), and annual values; white used for no significant trends or no snow cover (in case of snow variables). Positive values indicate an increasing trend and negative values indicate a decreasing trend. Catchments are sorted by elevation from highest to lowest.
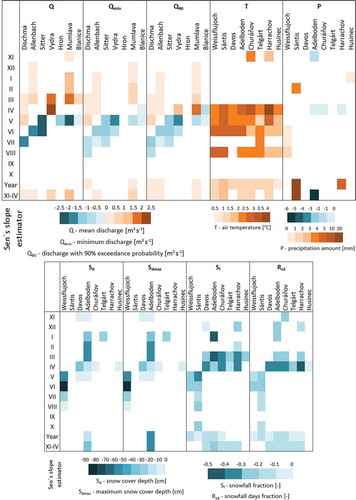
Figure 3. Relationship between air temperature, T, precipitation amount, P, and maximum snow cover depth, Sdmax, in the periods 1966–88 and 1989–2012.
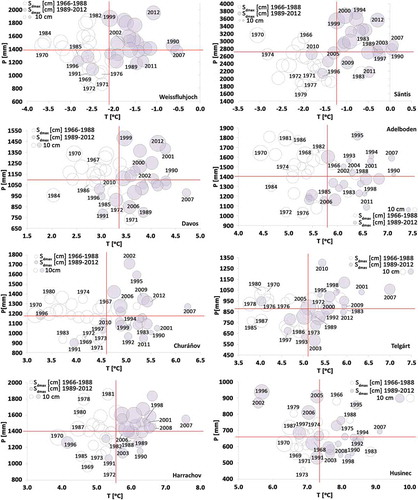
Figure 4. Shifts in the beginning and end of snow cover (Sddur) in the periods 1966–1988 and 1989–2012. Climate stations are sorted by elevation from highest to lowest.
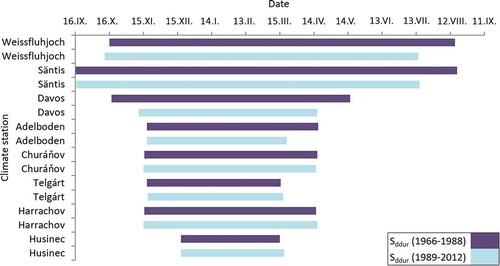
Figure 5. Comparison of snowfall fraction Sf and snowfall days fraction Rsd for air temperature thresholds 1°C, 0.5°C, and 0°C in 1966–2012 in April for Telgárt, in March for Adelboden, and in May for Säntis.
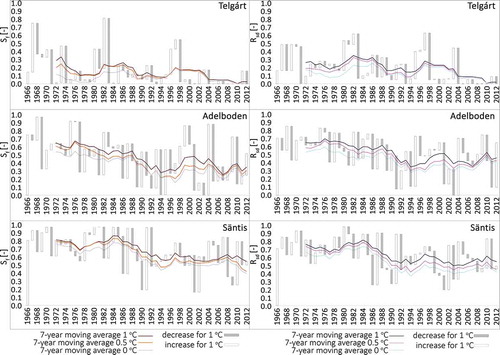
Figure 6. Correlation of snowfall fraction, Sf, with hydroclimatic parameters (air temperature, T; precipitation amount, P; snow cover depth, Sd; maximum snow cover depth, Sdmax; discharge, Q; minimum discharge, Qmin; and discharge with 90% exceedance probability, Q90) for months, the XI–IV season and years. Climate stations are sorted by elevation from highest to lowest.
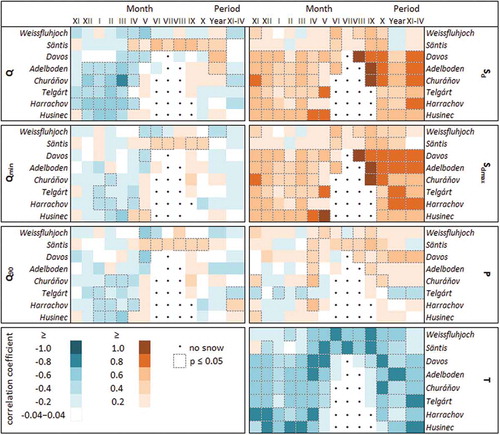
Figure 7. Dry periods and their typology in study catchments in 1966–2012 (based on methodology published in Van Loon Citation2015).
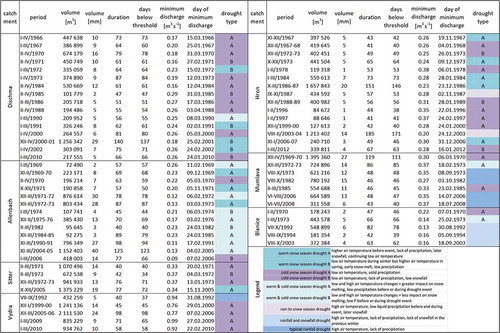
Figure 8. Typical evolution of dry periods for individual drought types. Solid lines represent the time series of each variable (mean monthly air temperature, precipitation, snowfall fraction, snow cover depth, and discharge); and dotted lines represent long-term means (1966–2012). The red line indicates the duration of the dry period.
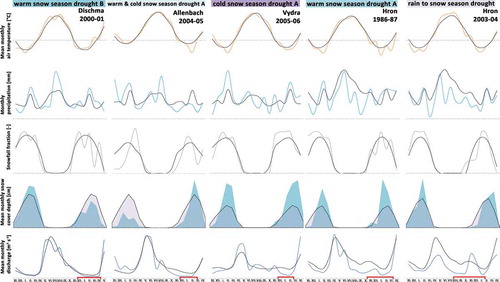
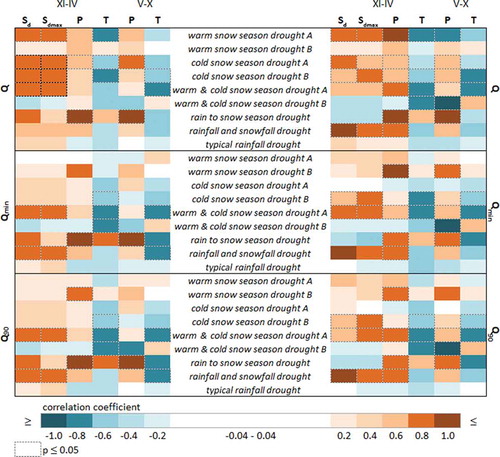
Figure 9. Correlation of hydrological (discharge, Q; minimum discharge, Qmin; and discharge with 90% exceedance probability, Q90) and climatic (snow cover depth, Sd; maximum snow cover depth, Sdmax; precipitation amount, P; and air temperature, T) variables in the cold (XI–IV) and warm (V–X) half-year that preceded the dry period (left) and the cold (XI–IV) and warm (V–X) half-year during and after the dry period (right).