Figures & data
Table 1. General information of meteorological stations and basic statistical parameters of the meteorological variables for the study period (1980–2017) for four stations located in the southern part of Japan. SD: standard deviation.
Figure 1. Location of meteorological stations used in this study in Kyushu Islands in the southern part of Japan.
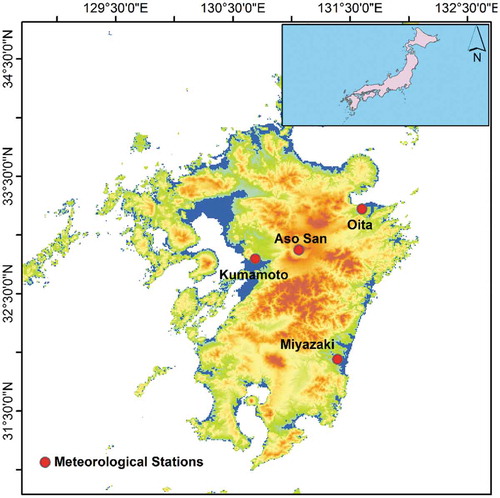
Table 2. Input variables for Prophet, SVR models and empirical formulas.
Table 3. Comparison between SVR and Prophet model with sole input of climatic variable for the test period.
Figure 2. Comparison of observed and estimated ETo by different models (SVR-1, P-1 and Thornthwaite) with Tavg as input parameters for the test period.
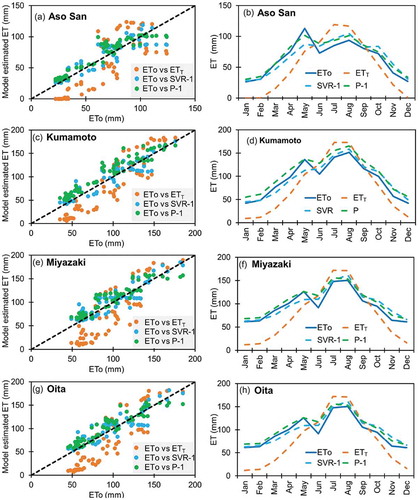
Figure 3. Correlation coefficient between ETo and climatic variables for the test period.
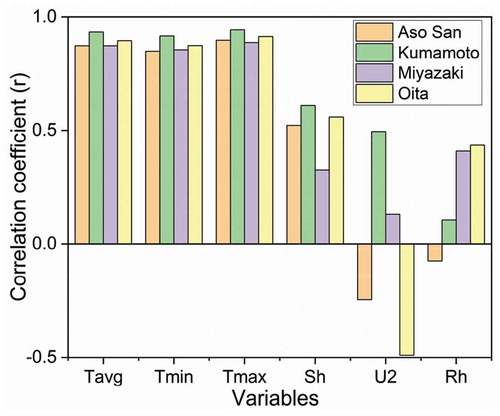
Table 4. Comparison between SVR and Prophet model with multiple input of climatic variables for the test period.
Figure 4. Comparison of observed and estimated ETo by different models (SVR-7, P-7 and Hargreaves) with Tmin and Tmax as input parameters for the test period.
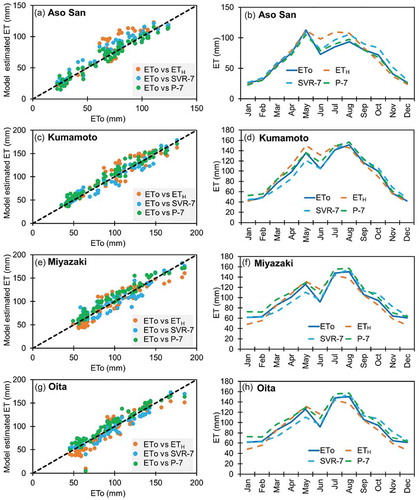
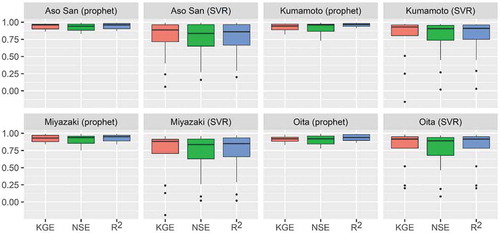
Figure 5. Comparison of accuracy of models with different input combinations for the test period.
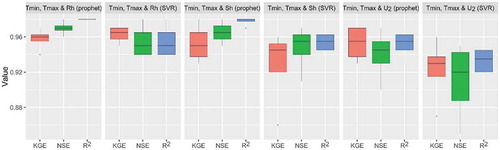
Figure 6. Comparison of observed and estimated ETo by the best models (SVR-12 and P-12) for the test period.
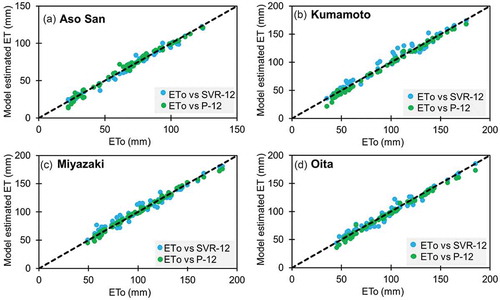
Figure 7. Comparison of accuracy of SVR (SVR-1 to SVR-12) and Prophet (P-1 to P-12) models with 12 different input combinations for the test period.