
Figures & data
Figure 1. Location of the study area in Alberta, Canada.
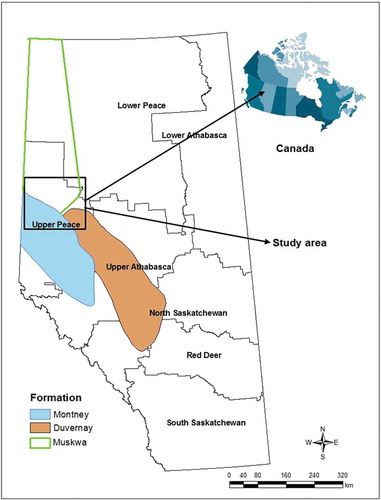
Figure 2. Surface water monitoring stations in the study area. Only one groundwater monitoring well is shown here as a water abstraction location for hydraulic fracturing.
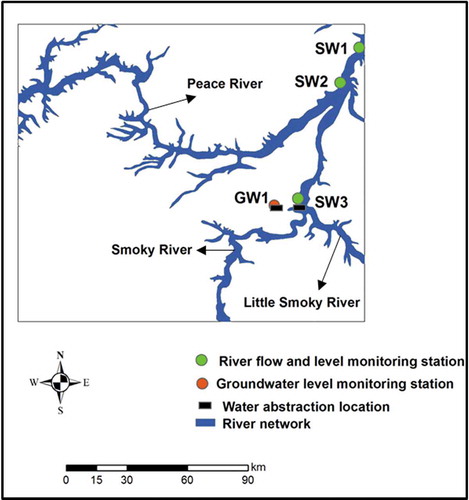
Table 1. Details of input data for the coupled MIKE-SHE and MIKE-11 model for the study area.
Table 2. Monthly number of hydraulically fractured wells and water use in hydraulic fracturing in 2013 and 2014.
Table 3. Different types of water abstraction scenarios for hydraulic fracturing activities.
Table 4. Performance statistics using observed and simulated streamflow, stream (i.e. river) water level and groundwater level data at various monitoring stations and wells during calibration and validation periods. R2: coefficient of determination; NSE: Nash-Sutcliffe efficiency criterion.
Figure 3. Comparison of observed and simulated streamflow by the developed model at the SW1 station (outlet of the study area), and observed and simulated river water levels at the SW3 station during (a) calibration and (b) validation periods.
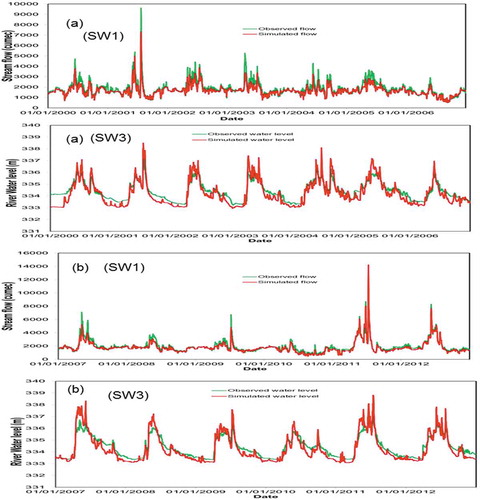
Figure 4. Comparison of observed and simulated groundwater levels by the developed model at the GW1 well during (a) calibration and (b) validation periods.
Figure 5. Increase in mean monthly groundwater contributions to streamflow under various types of water abstraction scenarios for hydraulic fracturing in (a) 2013 and (b) 2014 compared to the baseline scenario.
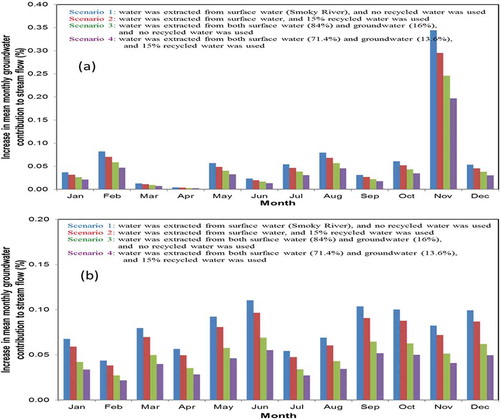
Table 5. Mean annual streamflow, groundwater discharge and surface runoff generated in the study area under the baseline scenario and various scenarios of water abstraction for hydraulic fracturing in 2013 and 2014. Values in parentheses are absolute changes between various scenarios of water abstraction for hydraulic fracturing and the baseline scenario, in which “–” indicates a decrease with respect to the baseline scenario. Note, there is no change in surface runoff.
Table 6. Mean annual groundwater contribution to streamflow under the baseline scenario and various scenarios of water abstraction for hydraulic fracturing in 2013 and 2014. Values in parentheses are absolute changes between various scenarios of water abstraction in hydraulic fracturing and the baseline scenario, in which positive values indicate an increase with respect to the baseline scenario.
Figure 6. Mean monthly river water level declines compared to the baseline scenario at the (a) SW3 and (b) SW2 stations under various types of water abstraction scenarios for hydraulic fracturing in 2013.
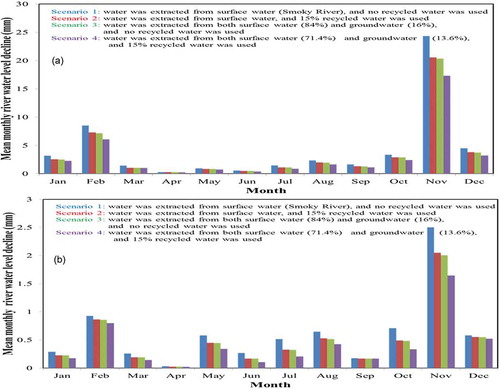
Table 7. Mean annual river water level declines compared to the baseline scenario at the SW3 station under various types of water abstraction scenarios for hydraulic fracturing in 2013 and 2014.
Figure 7. Mean monthly river water level declines compared to the baseline scenario at the (a) SW3 and (b) SW2 stations under various types of water abstraction scenarios for hydraulic fracturing in 2014.
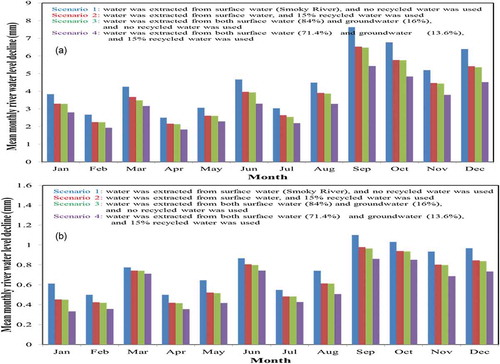
Table 8. Relative declines in environmental flow under various scenarios of water abstraction for hydraulic fracturing during low-flow periods in 2013 and 2014 with respect to the environmental flow under the baseline scenario.
Figure 8. Mean monthly groundwater level drawdown compared to the baseline scenario at the GW1 well under various types of water abstraction scenarios for hydraulic fracturing in (a) 2013 and (b) 2014.
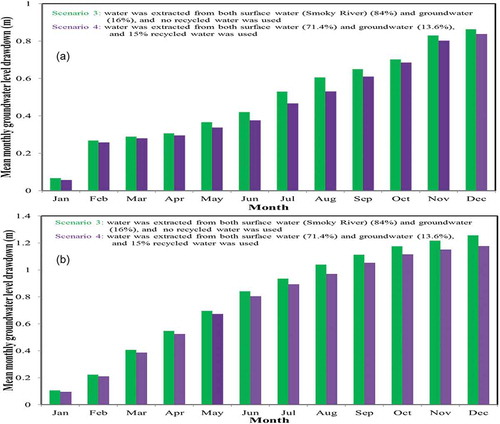
Table 9. Comparison of mean monthly river water level decline at the SW3 station and monthly water abstraction under Scenario 1 between 2013 and 2014.