Figures & data
Figure 1. Map of the study area and sites in Pakistan
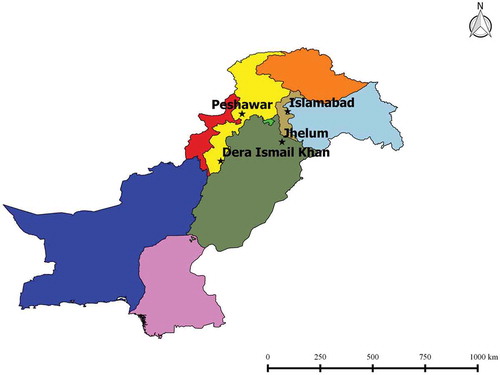
Table 1. Descriptive statistics of the study sites with their climate data and climate indices over the study period (1981–2015). Site 1: Islamabad, Site 2: Peshawar, Site 3: Jhelum, and Site 4: Dera Ismail Khan. SD: standard deviation
Table 2. Selected input predictors for each site using non-dominated sorting genetic algorithm of type II (NSGA). Ratio of selected inputs and root mean square error (RMSE) are also presented
Table 3. Schematic statistics used in the singular value decomposition (SVD) method for the decomposition of selected input predictors for each site
Figure 2. Detailed flow chart of the proposed multi-step non-sorting genetic algorithm of type-II (NSGA) integrated with singular value decomposition (SVD) and random forest – the NSGA-SVD-RF model
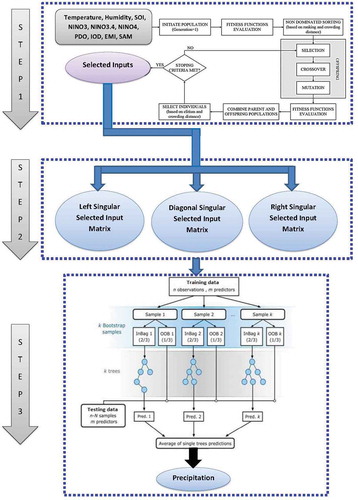
Figure 3. Scatterplot of the monthly forecasted and observed precipitation (PTCNFOR and PTCNOBS) (mm) in the testing phase for the proposed multi-step NSGA-SVD-RF, NSGA-SVD-KRR, NSGA-RF and NSGA-KRR models using the coefficient of determination (r2) and a linear fit inserted in each panel for (a) Site 1: Islamabad, (b) Site 2: Peshawar, (c) Site 3: Jhelum, and (d) Site 4: D. I. Khan
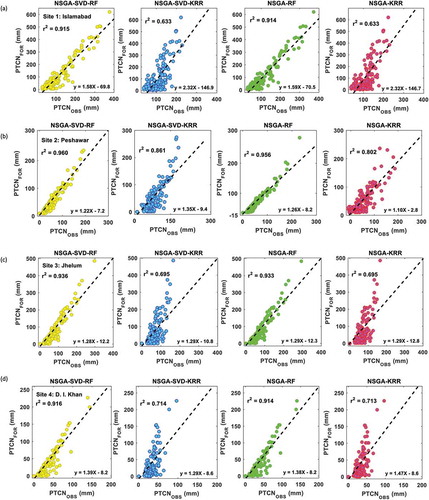
Figure 4. Boxplots of the monthly forecasted error |FE| (mm) between forecasted and observed PTCN in the testing period of the proposed multi-step NSGA-SVD-RF model vs the NSGA-SVD-KRR, NSGA-RF and NSGA-KRR models for Site 1: Islamabad, Site 2: Peshawar, Site 3: Jhelum, and Site 4: D. I. Khan
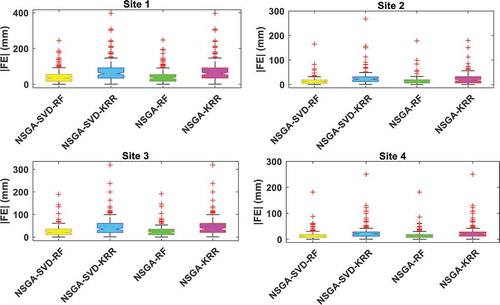
Table 4. Training performance of the multi-step NSGA-SVD-RF model vs the NSGA-SVD-KRR, NSGA-RF and NSGA-KRR models between monthly forecasted and observed precipitation in terms of correlation coefficient (r) and root mean square error (RMSE, mm). Bold indicates the best model
Table 5. Testing performance of the NSGA-SVD-RF model vs the NSGA-SVD-KRR, NSGA-RF and NSGA-KRR models measured by root mean square error (RMSE, mm), mean absolute error (MAE, mm), correlation coefficient (r) between monthly forecasted and observed precipitation. Bold indicates the best model
Figure 5. Empirical cumulative distribution function (ecdf) of the monthly forecasted error |FE| (mm) between forecasted and observed PTCN generated by the proposed multi-step NSGA-SVD-RF model vs the NSGA-SVD-KRR, NSGA-RF and NSGA-KRR models for Site 1: Islamabad, Site 2: Peshawar, Site 3: Jhelum, and Site 4: D. I. Khan
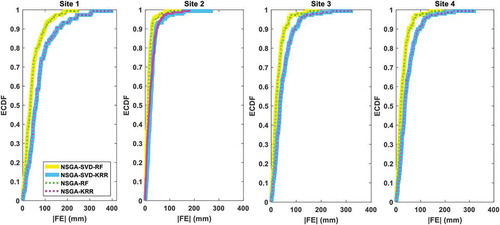
Table 6. Performance of the proposed multi-step NSGA-SVD-RF model vs the NSGA-SVD-KRR, NSGA-RF and NSGA-KRR models using the Willmott index (WI), the Nash-Sutcliffe efficiency (ENS) and the Legates-McCabe index (LM) in the testing period. Bold indicates the best model
Figure 6. Time series of the monthly forecasted and observed PTCN in the testing period using the proposed multi-step NSGA-SVD-RF model vs the NSGA-SVD-KRR, NSGA-RF and NSGA-KRR models for Site 1: Islamabad, Site 2: Peshawar, Site 3: Jhelum, and Site 4: D. I. Khan
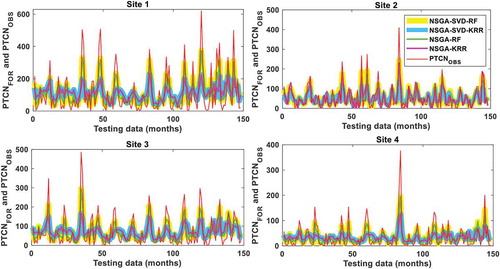
Figure 7. Polar plots showing the average monthly values of the monthly forecasted error |FE| (mm) between forecasted and observed PTCN in the testing period using the proposed multi-step NSGA-SVD-RF model vs the NSGA-SVD-KRR, NSGA-RF and NSGA-KRR models for Site 1: Islamabad, Site 2: Peshawar, Site 3: Jhelum, and Site 4: D. I. Khan
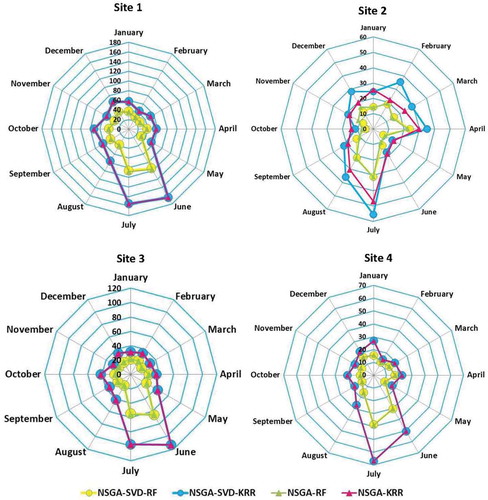
Table 7. Geographical comparison of the accuracy of the NSGA-SVD-RF model vs the NSGA-SVD-KRR, NSGA-RF and NSGA-KRR models in terms of relative root mean squared error (RRMSE, %) computed within the test sites. Bold indicates the best model
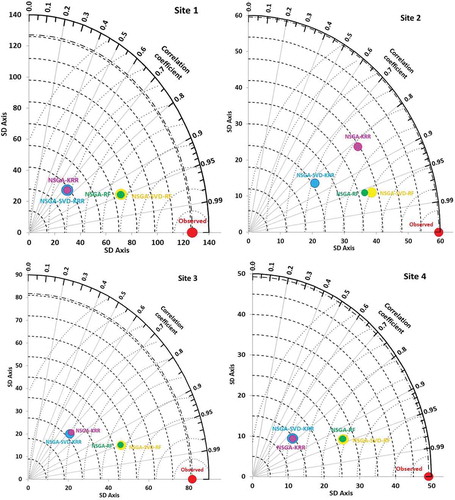
Figure 8. Taylor diagram showing the correlation coefficient between the monthly forecasted and observed PTCN (mm) and standard deviation for the proposed multi-step NSGA-SVD-RF model in comparison with the NSGA-SVD-KRR, NSGA-RF and NSGA-KRR models for Site 1: Islamabad, Site 2: Peshawar, Site 3: Jhelum, and Site 4: D. I. Khan