
Figures & data
Figure 1. Zayandeh Rud Dam Basin, Iran, showing all existing rain gauges located inside and outside the basin (black points) and the three validation stations (red points)
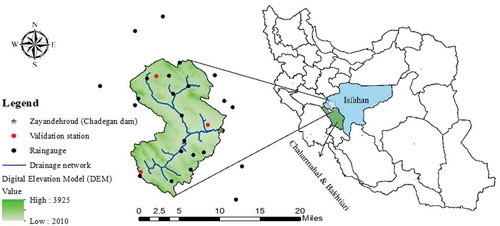
Figure 2. Three network sizes of (a) 15, (b) 10 and (c) 5 rain gauges
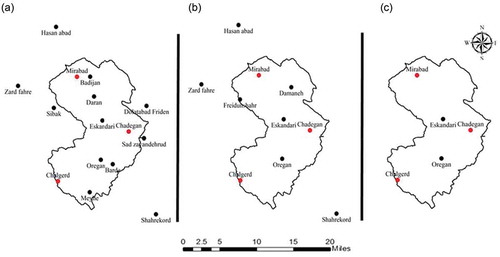
Figure 3. Dendrogram for all selected stations with cutting line (in red) at a distance of 2.5 mm
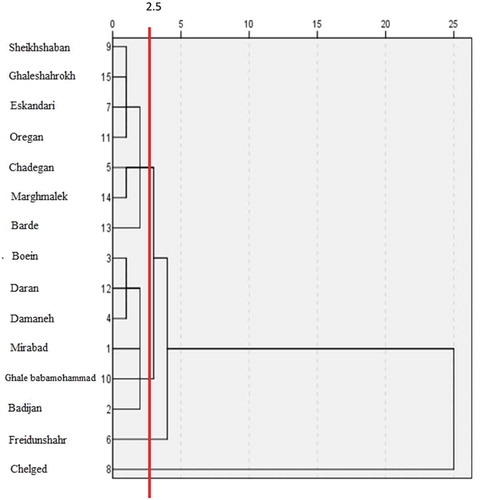
Figure 4. General flow chart of the research method
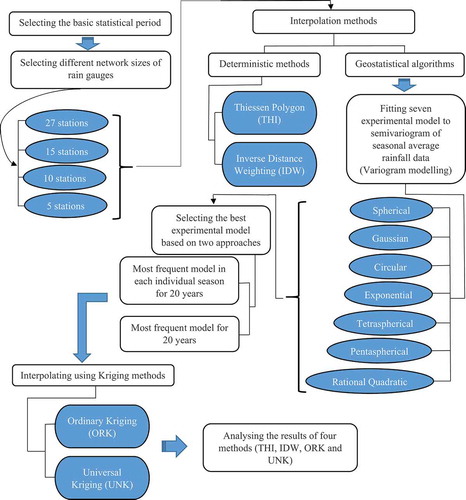
Figure 5. Number of fitted experimental models (seven models) to the semi-variogram for each season. The semi-variogram is based on seasonal average rainfall. (a) Chelgerd, (b) Chadegan and (c) Mirabad
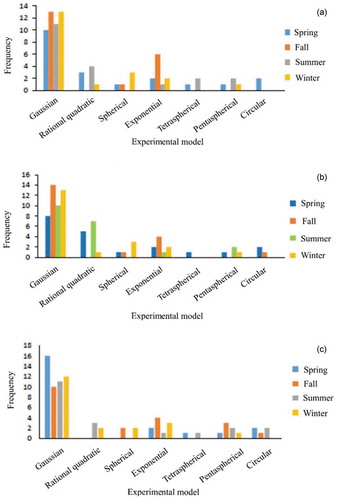
Table 1. Characteristics of different gauges maintained by the Ministry of Energy and Iran Meteorological Organization (IRIMO)
Table 2. Variance of daily rainfall for stations in different cluster groups. The validation station for each group is indicated in bold
Table 3. Performance metrics root mean square error (RMSE in mm) and the semi-variogram components (nugget and sill in mm; range in m) obtained using ordinary kriging and a network size of 27 gauges for interpolation for the four seasons of 1992 for the Chelgerd validation station. The model with the best performance is highlighted in bold
Table 4. Annual R values obtained for three validation points in interpolation using different methods and network sizes. ORK (Ordinary Kriging), UNK (Universl Kriging), IDW (Inverse Distance Weighting), THI (Thiessen)
Figure 6. RMSE and R obtained using different methods for the Chadegan station: (a) RMSE and (b) R for the 20-year period; and R for (c) spring, (d) autumn, (e) winter, and (f) summer
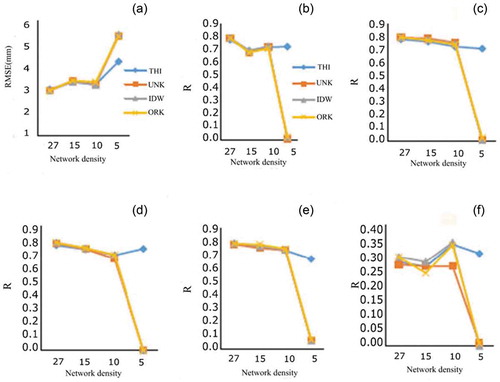
Figure 7. Observed and generated daily rainfall for three validation stations using different interpolation methods. (a) Mirabad, (b) Chadegan and (c) Chelgerd
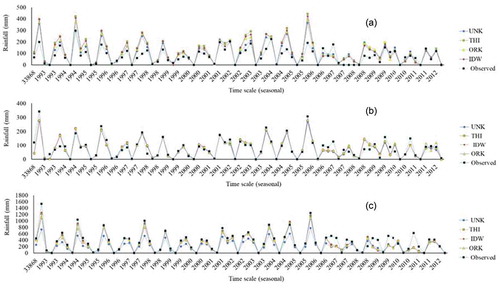
Figure 8. Boxplots of R values obtained from cross-validation for all gauges in interpolation using ORK and different network sizes
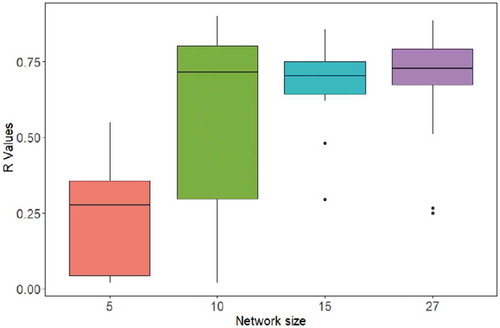
Table 5. Observed and predicted annual mean (Mean, mm) and annual maximum mean rainfall (Max, mm) obtained by interpolation via the best method and different network sizes for Mirabad, Chadegan and Chelgerd stations for all 20 years and four seasons