
Figures & data
Figure 1. Study area location map with rain gauges
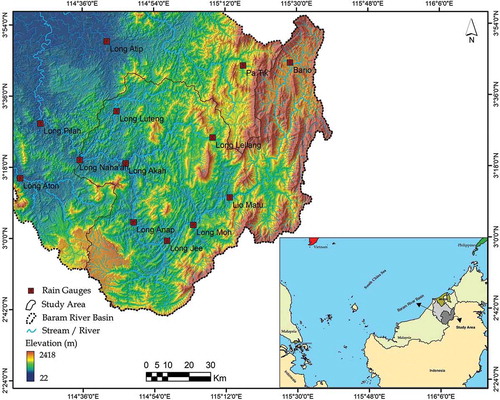
Table 1. Sources, scale and information of data layers used in the study
Table 2. Major soil types and proposed soil erodibility values
Table 3. Major land use/land cover (LULC) types and corresponding C factor values assigned to each
Figure 2. Temporal distribution of: (a–c) rainfall (mm) and (d–f) rainfall erosivity (MJ mm ha−1 h−1 year−1) during the three time frames (T1, T2 and T3). (Places listed are interior villages present in the study area)
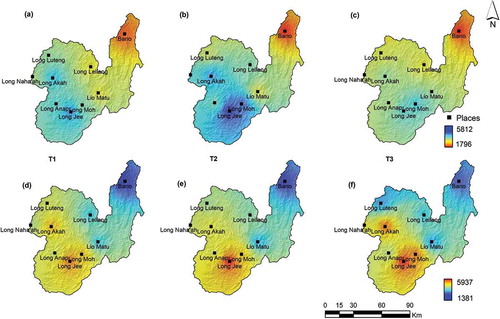
Figure 3. Temporal distribution of (a, b) NDVI, (c) land use/land cover and (d–f) corresponding cover management factors. See for abbreviations of land-use types
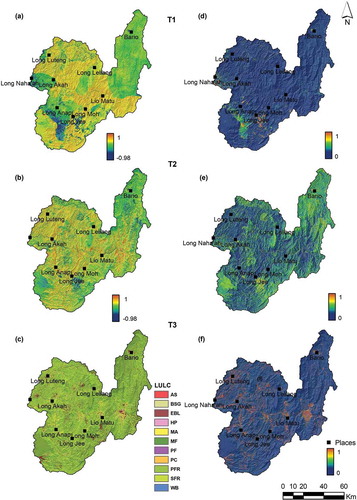
Figure 4. Spatial distribution of K factor in the study area
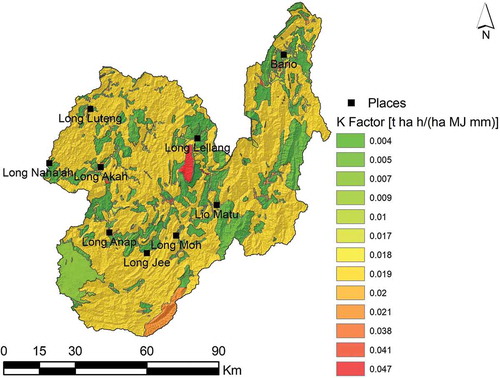
Figure 5. Spatial distribution of LS factor in the study area
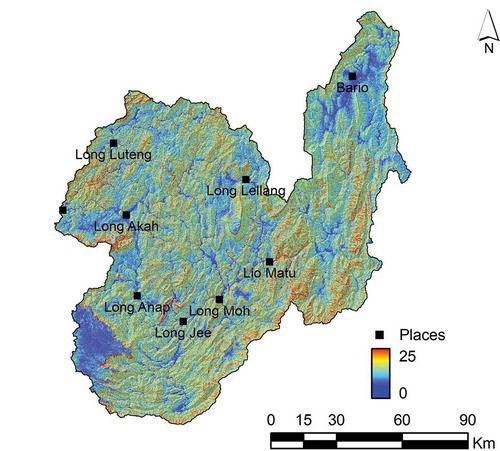
Table 4. Maximum and mean erosion rate in different time frames. T1: 1991–1994; T2: 2006–2007; T3: 2015
Table 5. Areal distribution of soil erosion vulnerability classes in the study area in different time frames
Figure 6. Spatial distribution of soil erosion rate in different time frames
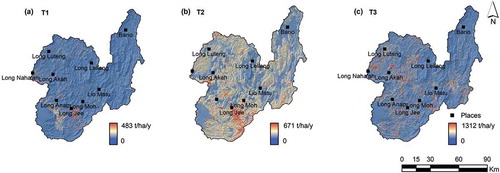
Figure 7. Spatial distribution of soil erosion vulnerability in different time frames
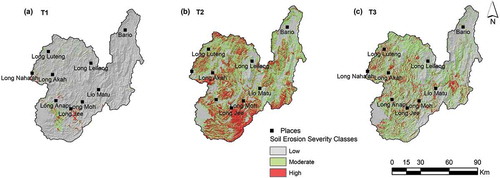
Figure 8. Boxplots explaining the statistical characteristics of soil erosion in the three time frames studied
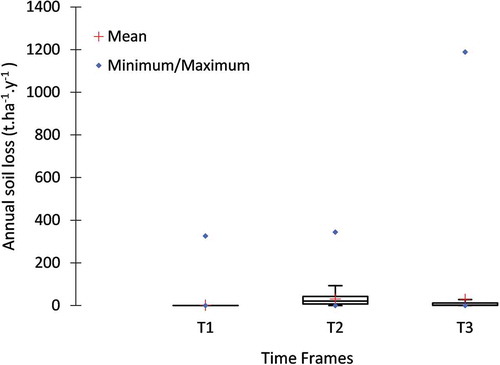
Figure 9. Areal distribution of erosion vulnerability classes in the study area
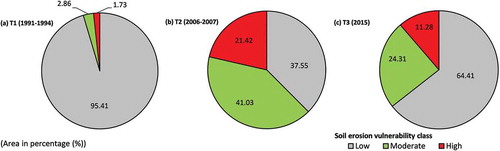
Table 6. Mean soil erosion corresponding to the most dynamic land-use activity in the study area
Figure 10. Spatial distribution of soil loss characteristics of the study area, identified through differencing of erosion rates calculated for the time frames considered
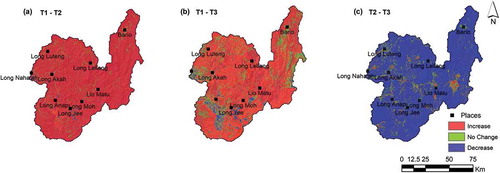
Figure 11. Spatial distribution of logging roads in the different time frames considered
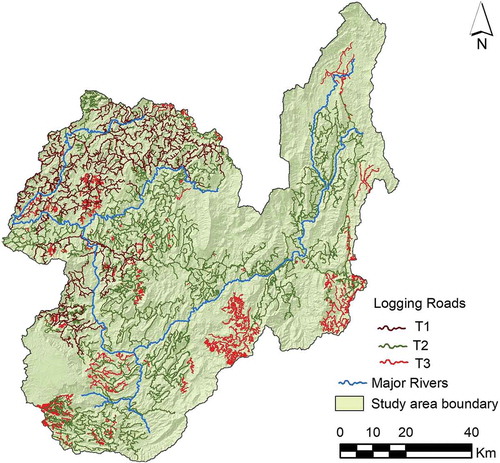
Table 7. Logging road characteristics in the Upper Baram catchment in different time frames. T1: 1991–1994; T2: 2006–2007; T3: 2015
Figure 12. Spatial distribution of logging road density in the study area
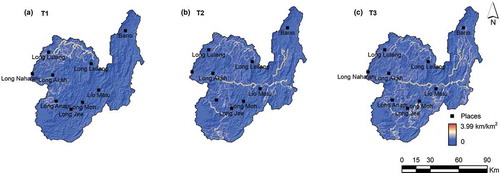
Table A1. Rainfall (mm) and rainfall–runoff erodibility factor (R, MJ mm/(ha/h year)) corresponding to different time frames. Time frame 1: 1991–1994; time frame 2: 2006–2007; time frame 3: 2015