
Figures & data
Figure 1. Study area location
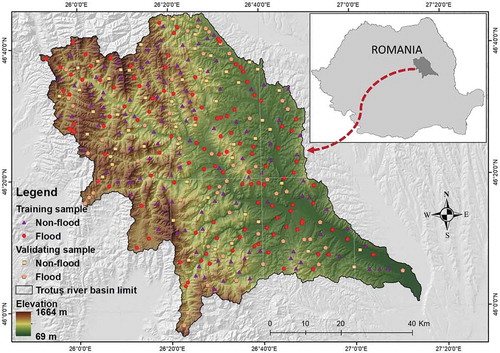
Figure 2. Flood predictors: (a) slope angle; (b) topographic position index (TPI); (c) land use; (d) plan curvature; (e) topographic wetness index (TWI); (f) aspect; (g) convergence index (CI); (h) hydrological soil group; (i) distance from rivers; (j) rainfall; (k) elevation; and (l) lithological category
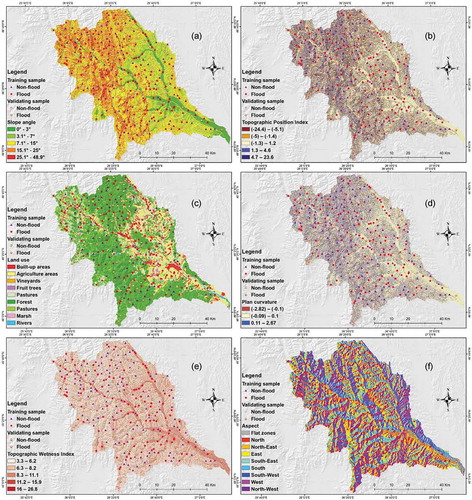
Figure 2. (Continued)
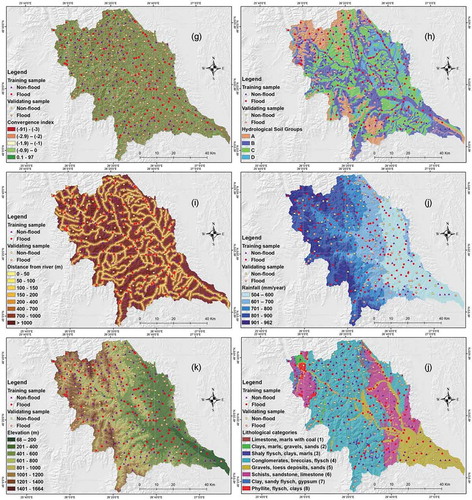
Figure 3. Frequency distribution of flood pixels within the flood predictor classes
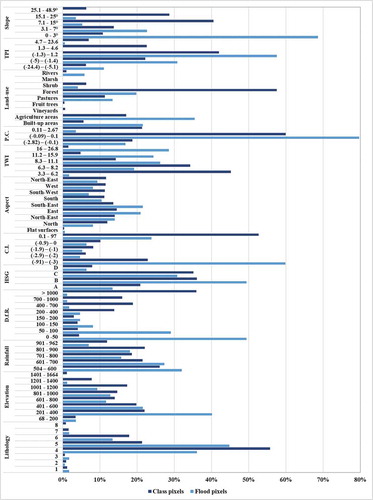
Figure 4. General ANFIS architecture of first-order Takagi-Sugeno fuzzy model
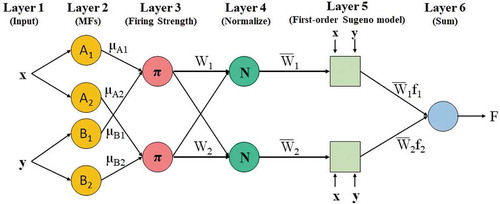
Figure 5. Flowchart of the developed methodology. ANFIS - Adaptive Neuro-Fuzzy Inference System; AHP - Analytical Hierarchy Process; CF - Certainty Factor; WOE - Weights of Evidence; RMSE - Root Mean Sqaured Error; K-index- Kappa Index; FPI - Flood Potential Index
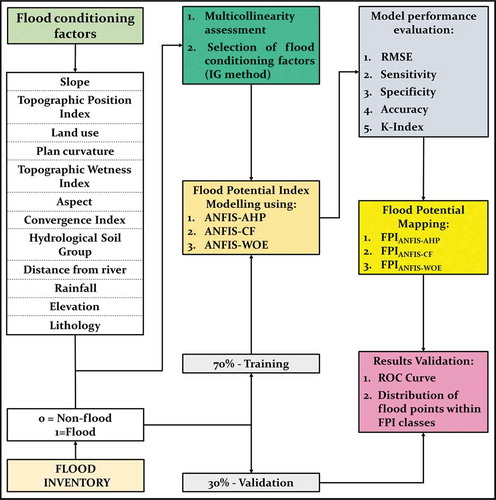
Figure 6. Performance in terms of RMSE calculated for the training dataset: (a) ANFIS-AHP, (c) ANFIS-CF and (e) ANFIS-WOE, and the validation dataset: (b) ANFIS-AHP, (d) ANFIS-CF and (f) ANFIS-WOE
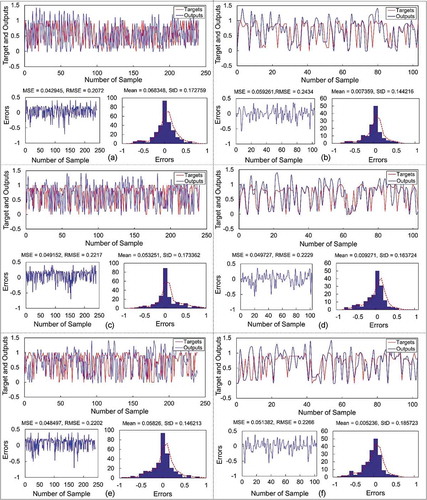
Table 1. Random consistency index (RI; after Saaty Citation1980)
Table 2. Multicollinearity analysis and predictive ability of independent variables. TPI: topographic position index; TWI: topographic wetness index; TOL: tolerance; VIF: variance inflation; IG: information gain
Table 3. Pairwise comparison matrices
Table 4. Pairwise comparison matrix properties. CI: consistency index; CR: consistency ratio; RI: random consistency index; TPI: topographic position index; TWI: topographic wetness index
Table 5. Certainty factor (CF) and weight-of-evidence (WOE) coefficients. TPI: topographic position index; TWI: topographic wetness index
Table 6. Statistical metrics used to evaluate model performance. TP: true positive; TN: true negative; FP: false positive; FN: false negative
Figure 7. Relative importance of flood conditioning factors
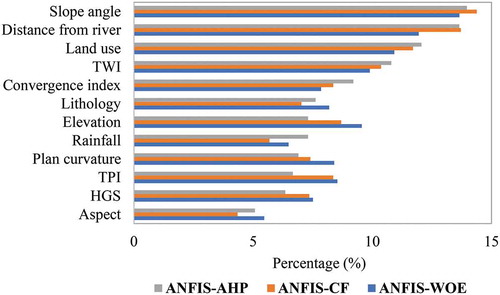
Figure 8. Map of FPIANFIS-AHP values across the Trotuș River basin
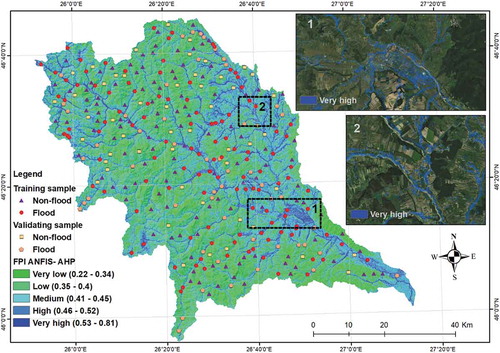
Figure 9. Map of FPIANFIS-CF values across the Trotuș River basin
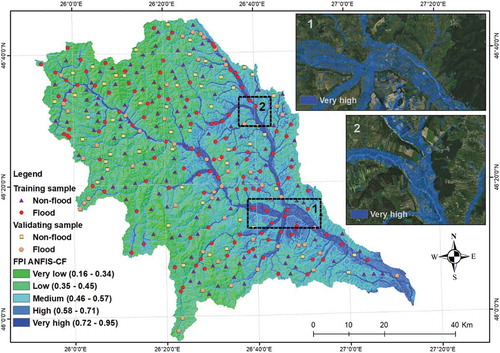
Figure 10. Weights of the FPI classes
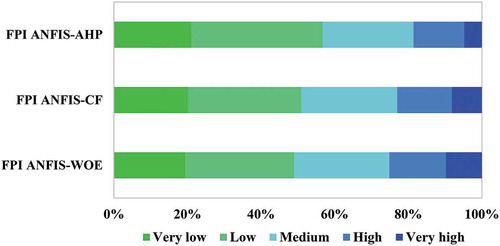
Figure 11. Map of FPIANFIS-WOE values across the Trotuș River basin
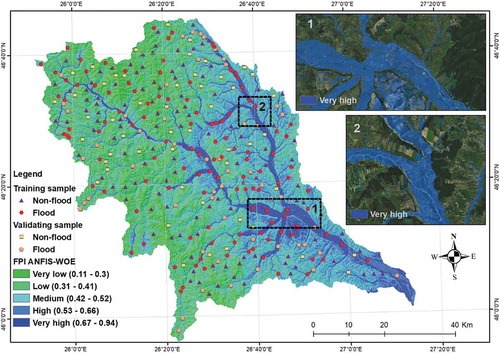
Figure 12. ROC curves: (a) success rate and (b) prediction. AUC: area under curve
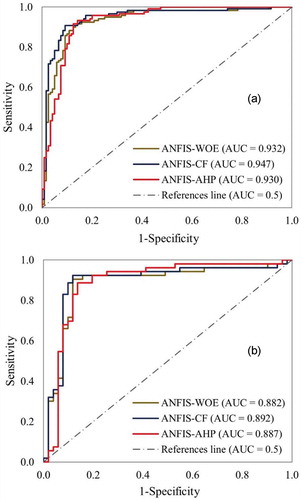
Table 7. Flood point distribution (%) within FPI classes