Figures & data
Figure 1. Location of streamflow stations. Key stations are highlighted (triangles) and labelled. The stations colour represents its region according to ONS standards
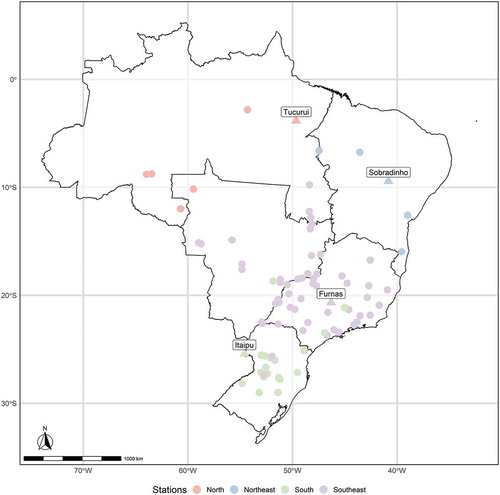
Figure 2. Penalty values of the synthetic series obtained from different penalty functions and CROPS method. Maximum, minimum and median values of each penalty function are shown at the bottom left, bottom right and top, respectively. CROPS maximum, minimum and median values were 6.53, 0.05 and 0.65
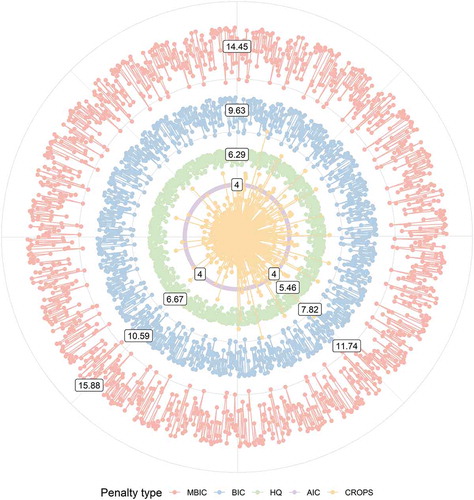
Table 1. Detection and convergence rate of Pettitt test, Bai and Perron’s algorithm and Pruned Exact Linear Time method for the synthetic series
Table 2. Statistical properties of each segment: mean (μ), standard deviation (σ) and coefficient of variation (CV)
Figure 3. Change point results for the mean value (bold lines) of climate indices and of the streamflow series of key stations
Figure 4. Percentage difference between the complete series mean value and the latest change point mean value, along with the convergence among the three change-point methodologies
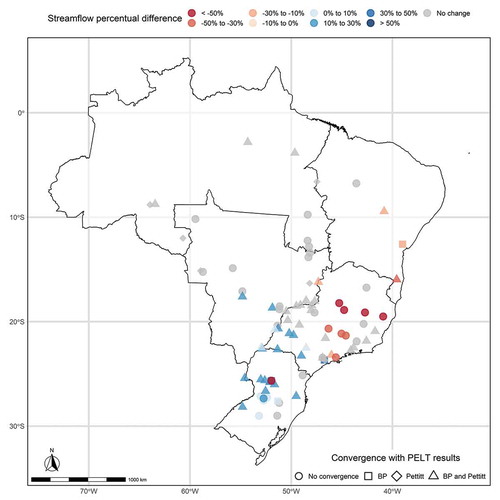
Figure 5. Comparison between mean value change point results of climate indices and annual streamflow. Numbers on the right are station numbers; 168, 6 and 266 refer to the key stations Sobradinho, Furnas and Itaipu, respectively
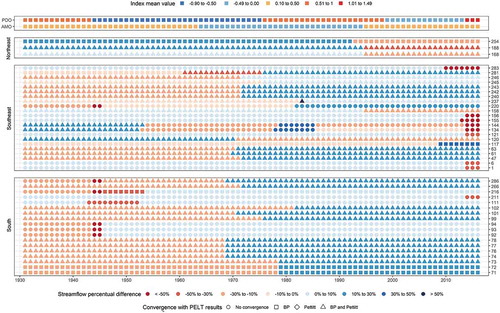
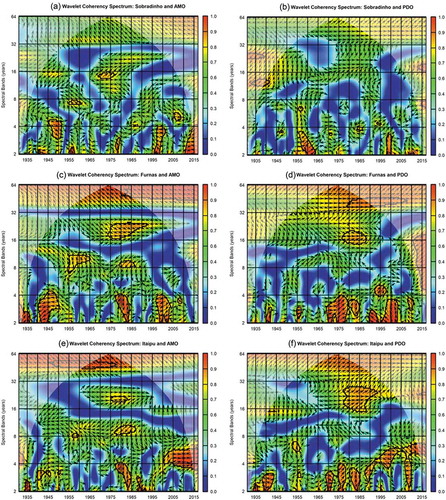
Figure 6. Wavelet coherence results between the key stations and climate indices, AMO (left) and PDO (right). The thick black contour line indicates the 5% significance level. The cone of influence is represented in white and indicates a border effect in the highlighted results