Figures & data
Figure 1. Conceptual procedure for setting the inter-annual and seasonal variability limits of the hydrological conditions of low flows based on frequencies of occurrence
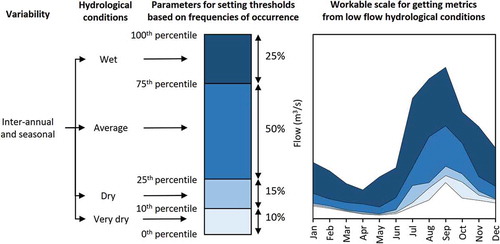
Figure 2. Conceptual procedure for setting the peak-flow events based on frequencies of occurrence. (a) First, the daily maximum annual flow per year of the complete set of records is identified. (b) Second, the characteristic magnitude of the peak flows is set based on the average magnitude associated with a return period of 1, 1.5 and 5 years derived from historical, log-normal, Gumbel and log-Pearson Type-III logarithmic regression models. (c) Third, the events from characteristic magnitudes are identified in the full set of records and filtered from the low-flow component. Fourth, from this filtered set of records the characteristic duration (d) and timing (e) of the peak-flow events are identified and their cumulative frequency is calculated. Fifth, the degree of daily changes (f) is calculated for rise and fall rates
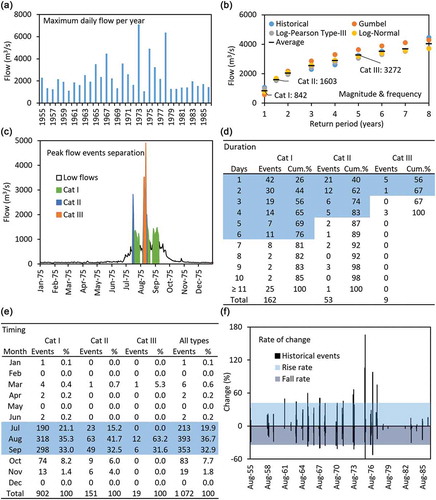
Table 1. Frequency factors of occurrence for the integration of low-flow regimes into annual volumes for environmental water allocation, according to a desired ecohydrological state and environmental objective class
Table 2. Frequency factors of occurrence for the integration of the peak-flow events (categories I, II and III) into annual volumes for environmental water allocation, according to the desired ecohydrological state and environmental objective class
Figure 3. Overall schematic procedure to determine environmental volumes for annual-based water allocation according to the hydrology-based frequency-of-occurrence approach
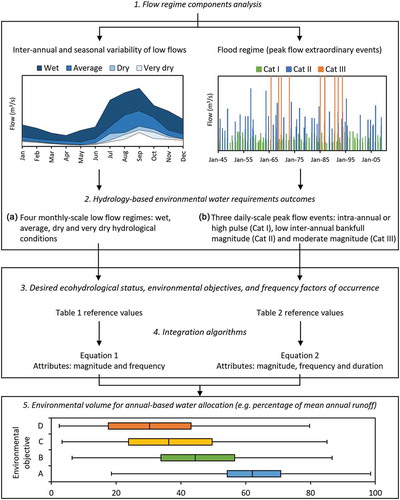
Table 3. Flow variability indices for both the reference (earlier) and the assessment (later) periods from the case studies. MAR: mean annual runoff, CV: coefficient of variation, MABF: mean annual baseflow, BFI: baseflow index and CVB: overall index of flow variability (CV/BFI)
Figure 4. Reference and assessment low-flow discharge residuals (a–c), scatter plots of the low-flow hydrological conditions (d–f) and scatter plots of the integrated low flows based on the frequency factors of occurrence according to each environmental objective class (g–i)
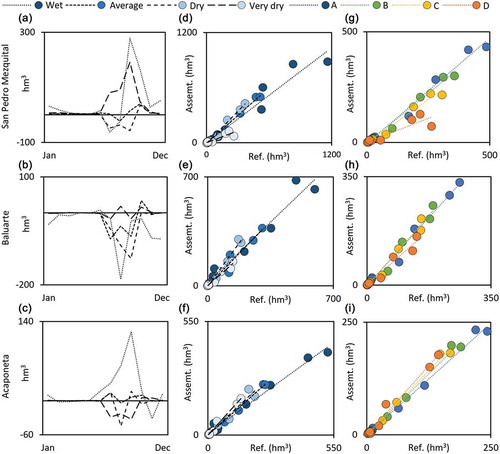
Figure 5. Scatter plots from characteristic magnitudes for 16 peak-flow events (floods) associated to different return periods between the reference and assessment periods (a–c), and their logarithmic distribution individual models (d–f)
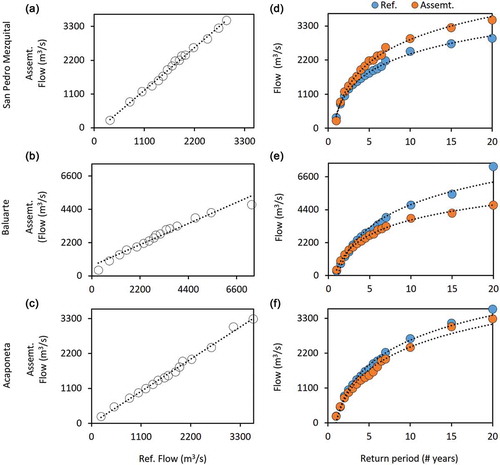
Figure 6. Daily maximum annual flow per year of the complete set of records and magnitudes of the peak-flow events of the case studies. The event magnitudes correspond to 1-, 1.5- and 5-year return periods (Categories I, II and III, respectively) for both the reference and assessment periods (left and right in each graph)
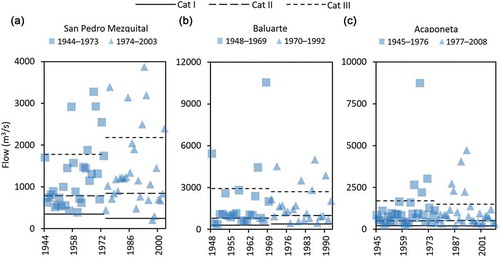
Figure 7. Number, duration (days) and cumulative frequency (percentage) of the peak-flow events of the case studies. The event magnitudes correspond to 1-, 1.5- and 5-year return periods (Categories I, II and III, respectively) from the reference (a, c and e) and assessment (b, d and f) periods
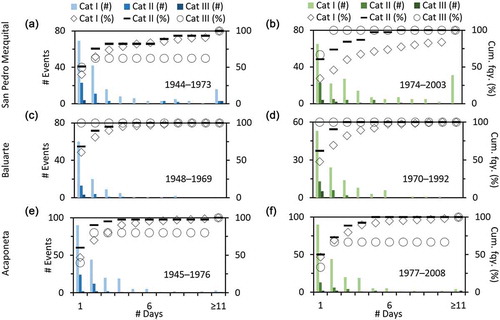
Table 4. Coefficient of determination (R2) and slope between the periods of reference and assessment for the performance validation indicators of the case study rivers
Table A1. Low flow volumes for water allocation per hydrological condition and environmental objective class according to EquationEquation (1)(1)
(1) . MAR: mean annual runoff
Table A2. Peak flow event attributes and flood regime annual volumes for water allocation per environmental objective class according to EquationEquation (2)(2)
(2)
Table A3. Magnitude of the peak-flow extreme events associated with each recurrence interval (return period in years) from both the reference and assessment periods of the case study rivers
Figure A1. Location of the San Pedro Mezquital, Baluarte and Acaponeta rivers
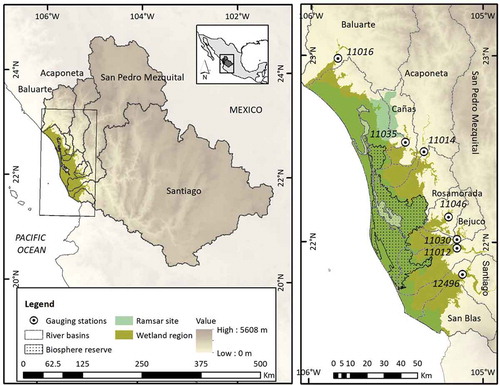
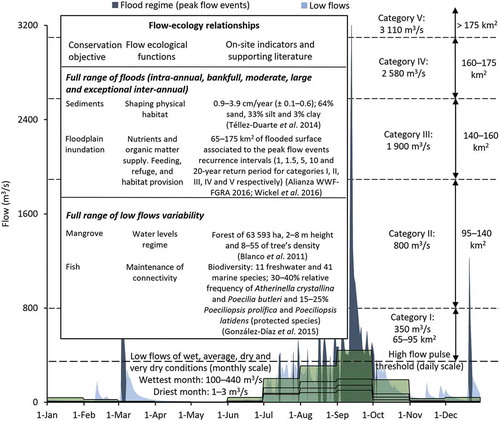
Figure A2. Flow–ecology relationships of the San Pedro River in Marismas Nacionales (basin lowlands). The conceptual hydrograph is shown at two time scales: daily, for differentiating the peak-flow events of the flood regime (dark blue; categories in dashed lines) from low flows (light blue); and monthly, for the low-flow regime thresholds (light green and solid lines)