Figures & data
Figure 1. The Alto do São Francisco River catchment with the drainage system and the stream gauging stations selected for this study (left) and location map (right)
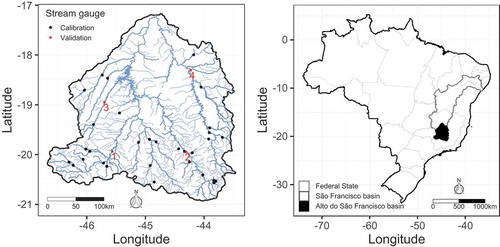
Table 1. Streamflow gauging stations utilized for regional flood frequency analysis. N is the length of the maximum annual daily streamflow series
Figure 2. Scaling behaviour of the generalized extreme value (GEV) parameters with the catchment drainage areas
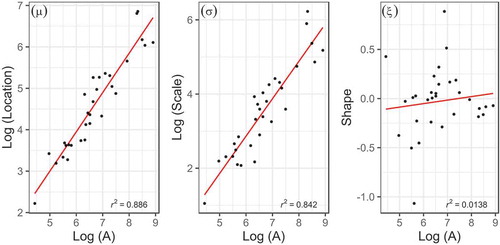
Figure 3. Generalized extreme value shape parameter maximum likelihood estimates (MLEs) in the study region
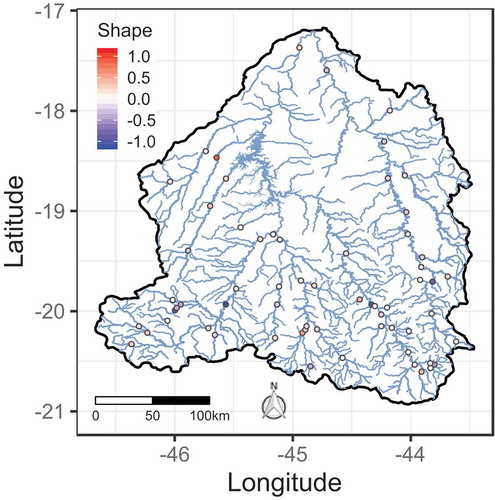
Figure 4. Posterior estimates of regression parameters. ,
and
are, respectively, location, scale and shape parameters
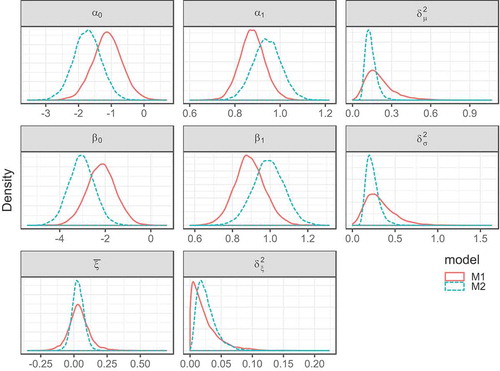
Figure 5. Correlations among the parameters of the spatially dependent model (M1) and the spatially independent model (M2), and the corresponding regression errors
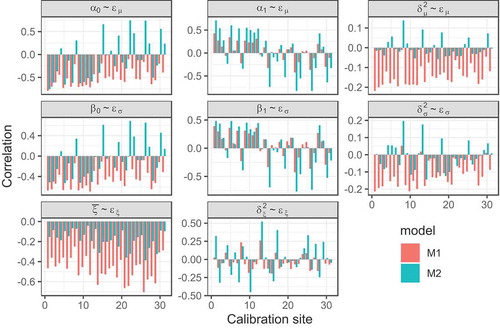
Figure 6. Posterior estimates of the generalized extreme value (GEV) parameters under models M1 and M2. Model M1 point estimates and 95% credible bounds are indicated, respectively, by black circles and vertical black lines; Model M2 point estimates and their 95% credible intervals are indicated by red dashes
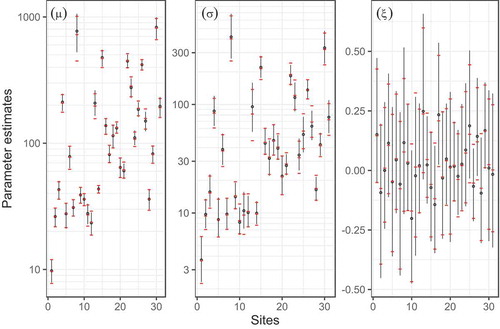
Figure 7. Spatial predictive distribution of the regression errors
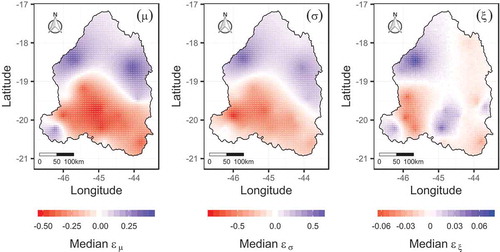
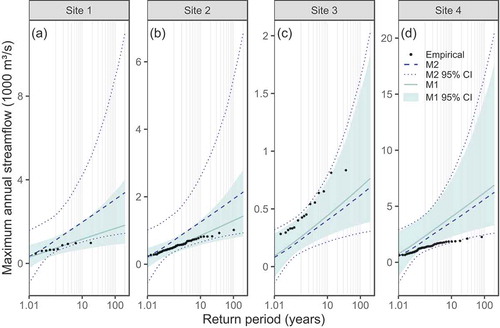
Figure 8. Quantile curves of the validation sites and their 95% credible intervals estimated by models M1 and M2