Figures & data
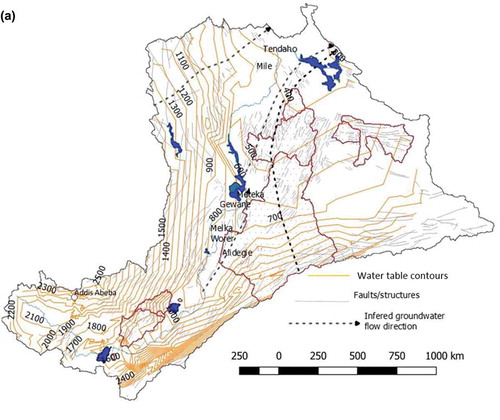
Figure 1. Location map showing salient features of the River Awash Basin (irrigation water intake sites, geothermal spring discharge sites, extent of major aquifers, drainage, closed basins enclosed within the River Awash Basin, and place names). The major regional aquifers are those bounded inside numbered polygons
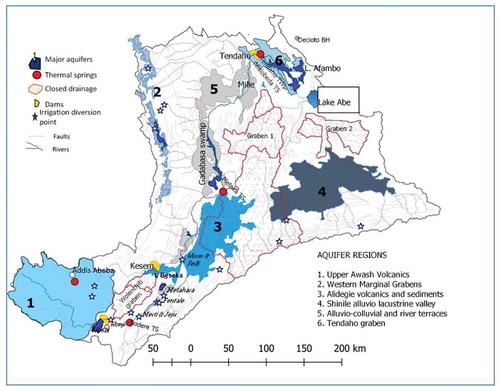
Figure 2. Locations of river gauging stations on the River Awash and its headwater tributaries; polygons inside the basin denote closed surface water sub-basins; most river flow originates from the Upper Awash Basin, upstream of Lake Koka in the southwest
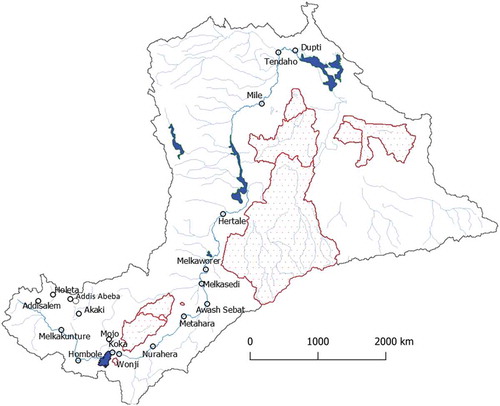
Table 1. Salient features of the major aquifers in the Awash Basin. U = unconfined, SC = semi-confined, A = artesian, UWS = urban water supply, Ir = irrigation, Ind = industry, RWS = rural water supply. Source: Ministry of Water Irrigation and Electricity groundwater study reports pertaining to the stated aquifers (2008–2018)
Figure 3. The 18O-2H plot of surface and groundwaters from selected spots in the Awash Basin; (a) shows map regions for which isotope plots (b–f) are made. LMWL = local meteoric water line, TS = thermal spring, Sp = spring, BH = borehole
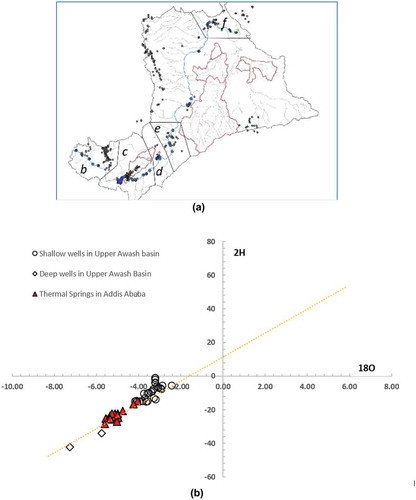
Figure 3. (Continued)
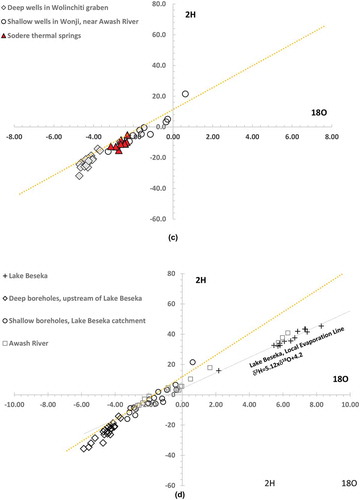
Figure 3. (Continued)
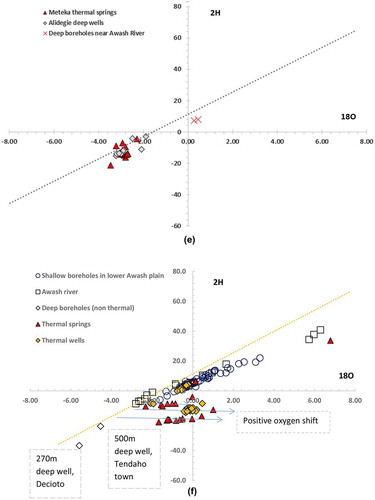
Figure 4. Pattern of 222Rn and electrical conductivity (EC) in the main course of the River Awash: (a) wet-season 222Rn, (b) dry-season 222Rn, (c) dry-season EC, and (d) wet-season EC. 222Rn is in Bq m−3 and EC is in µS cm−1
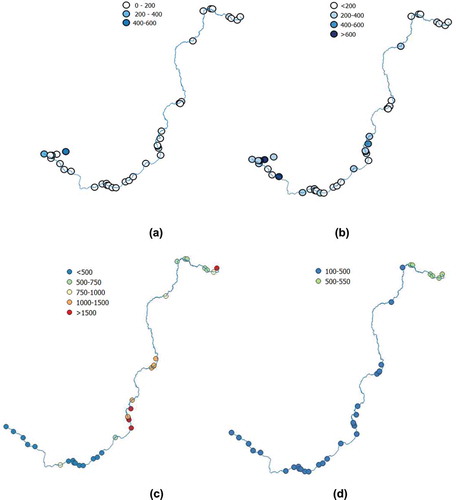
Figure 5. 222Rn pattern in the Lake Beseka water surface (measurement from 2014)
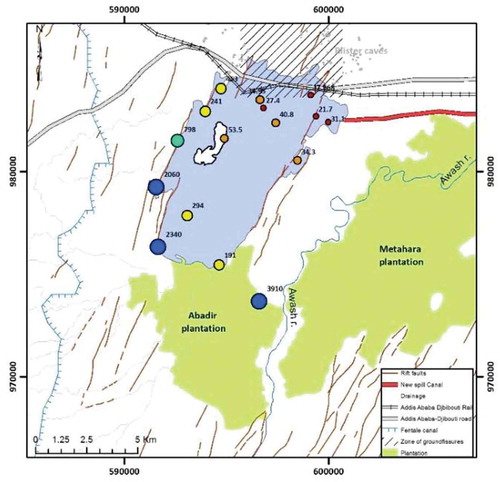
Figure 6. (a, left) Water level changes in the Metahara plantation areas between 1988 and 2008, shown in graduated colour; numbers near the dots show the 2008 water level in metres above sea level. The blue area is Lake Beseka, and green areas are irrigation command areas. The hatching shows the new (2011) irrigation canal. (b, right) Current piezometric water level at Melka Worer-Melka Sedi farms; numbers indicate water level in metres above sea level. The inferred direction of groundwater flow and a piezometric contour map are also shown
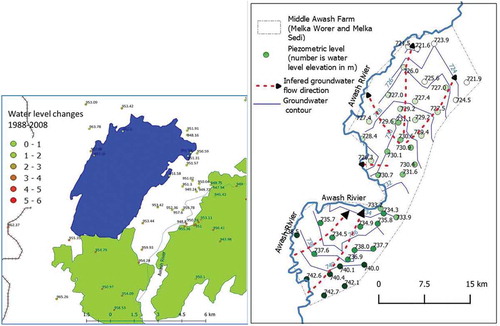
Figure 7. Simplified water loss and gain accounting and potential attributions at multiple locations in the River Awash main channel (see for location of the gauging stations)
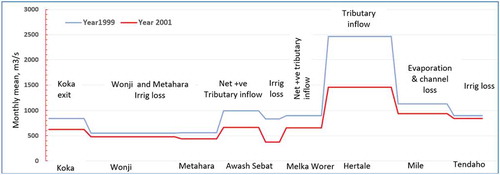
Figure 8. Regional water table map