Figures & data
Figure 1. Location of the study area, representing the catchment area of Chorabari glacier (solid line), Chorabari Lake (dotted lines), and the physiographical setup of the area
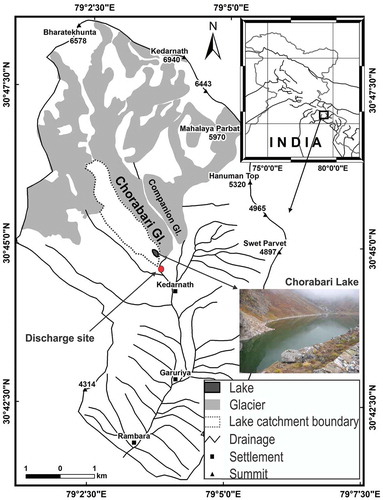
Figure 2. Average meteorological conditions of Chorabari Lake for the period 2011–2013
Table 1. Statistical composition parameters of the parent rock used in the present study
Table 2. Statistical parameters for sediments of different grain size, representing trace element concentrations
Table 3. Statistical parameters for sediments of different grain size, representing trace element concentrations
Figure 3. Petrography of major rock types at Chorabari glacier catchment
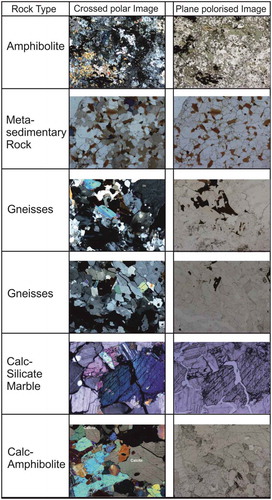
Figure 4. Distribution of (a) major oxides (wt %) and (b) trace elements (ppm) in sediments of different grain-size classes, normalized to their distribution in the underlying bedrock. Error bars are 2σ standard deviations, reflecting both uncertainty in the bedrock composition and variability in the sampled sediment
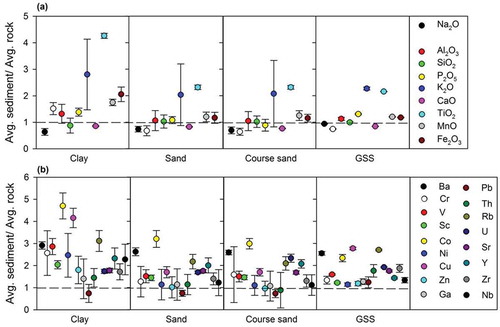
Figure 5. Percentage change for individual elements vs. chemical index of alteration for major elements of clay, sand, coarse sand and glacier suspended sediments (GSS). The percentage change is on the ordinate and the chemical index of alteration is on the abscissa
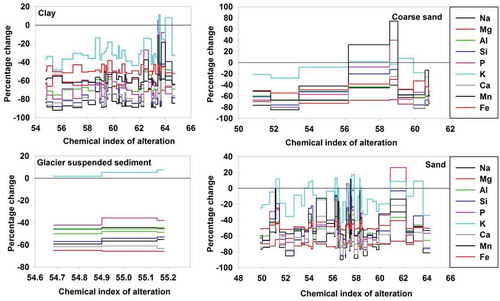
Figure 6. The percentage change of fractions of different grain sizes presenting feldspar alteration through sodium and calcium (weight %) as the most leached elements compared to the parent rock composition
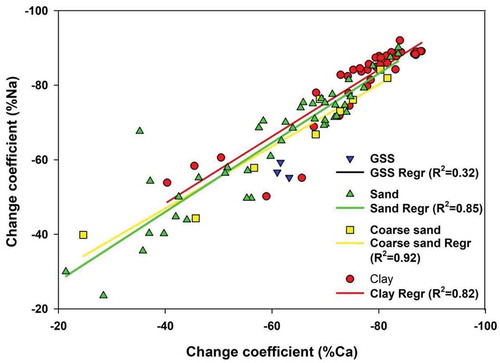
Figure 7. X-ray diffractograms of the separated clay sized fraction showing palygoskite with associated illite in the clayey sample (L2), whereas in sandy samples sepiolite and illite, along with non-clay minerals (with traces of calcite) and diffraction patterns collected after glycolation, show a peak shift due to -OH adsorption. Anor, anorthite; gly., glycolated
Figure 8. Bivariate plot of major elements to determine the extent of correlation for various immobile and mobile elements for all possible weathering cases. (a), P plotted with Ca to determine the association of P with calcsilicate rocks; (b), P plotted with Al to determine the association of P with aluminosilicate rocks; (c), Fe plotted with with Al to understand the association of Fe with aluminosilicate rocks; (d), Ca plotted with Al to determine the association of calcium- and magnesium-phase dissolution with calcsilicate rocks
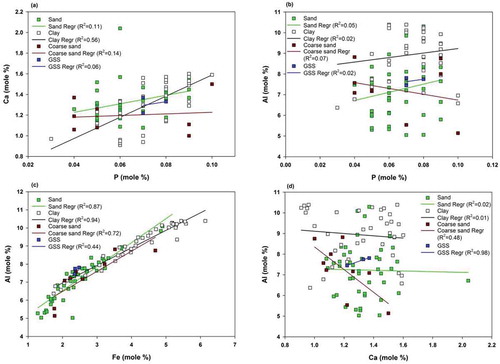
Figure 9. Bivariate plots for molar proportions of major elements to study the release of elements from micaceous minerals. (a) Correlation of Mg with Al/Si to determine the association of Mg with minerals containing mica; (b) correlation of K with Al/Si to determine the association of Mg with minerals containing mica
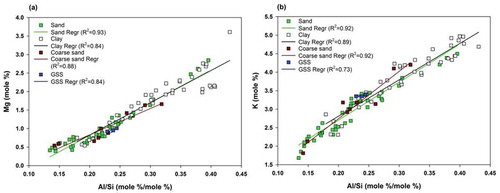
Figure 10. Al2O3-(CaO+Na2O)-K2O diagram of glacial sediments suggesting the weathering history of the catchment. Chl, chlorite; Ka, kaolinite; Gi, gibbsite. The dotted line represents the overall trend of weathering, and the dashed line represents the metasomatic trend and the corresponding pre-metasomatized chemical index of alteration (CIA) values for premetasomatized samples
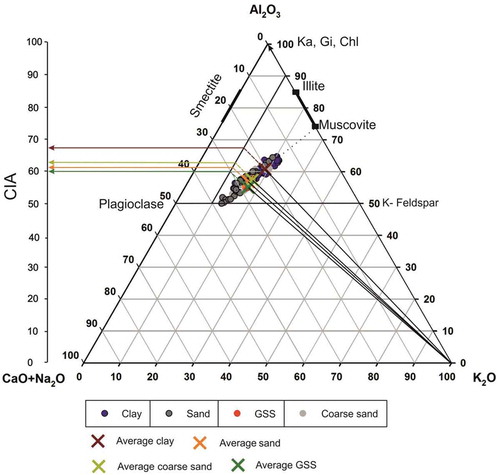
Figure 11. (a). Chemical maturity of sediments in all sets of weathering environments, suggesting a link between changing climatic conditions and the resulting sedimentation in the catchment. (b) Bivariate plots of Al2O3 and K2O depicting the decomposition of K-feldspars and muscovite during progressive weathering, and the possible origin of sediments close to the illite line (Cox and Lowe Citation1995)
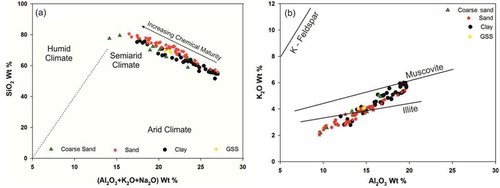
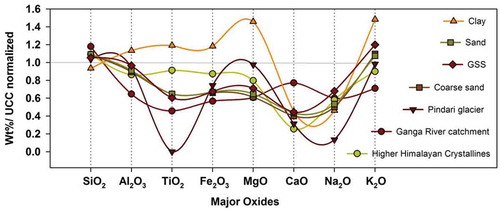
Figure 12. UCC normalized ratio of major oxide composition by weight %. Ganga River catchment suspended sediment data from Singh (Citation2010); Higher Himalayan Crystalline data from Galy and France-Lanord (Citation2001); Pindari Glacier suspended sediment data from Pandey et al. (Citation2002); clay, sand, coarse sand, and glacial suspended sediments (GSS) data from the present study