Figures & data
Figure 1. Mapping the case study. (a) Location of São Paulo State on a map of Brazil; (b) river basin thresholds in São Paulo state; (c) São Carlos city limits, showing the water bodies and sanitation facilities
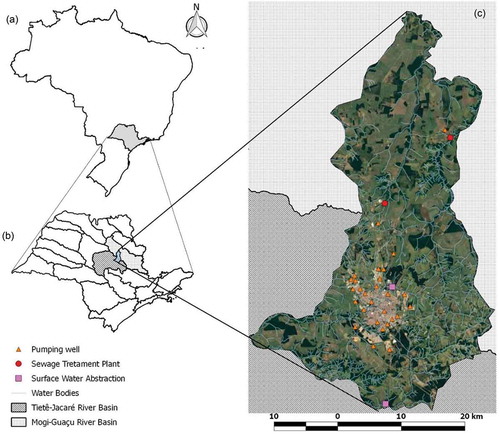
Figure 2. General methodology proposed to account for blue and grey water footprints in sanitation processes on an urban scale, including both time series and citizen participation
Table 1. List of datasets used in this work to account for the blue water footprint (BWF) and the grey water footprint (GWF) at the municipal scale. BRL: Brazilian real; GDP: gross domestic product
Table 2. Questions asked of volunteers who live in the case study area. Question 1 (which included four parts, a–d) allowed us to characterize the citizens who participated in this study. Question 2 (in parts a–d) asked about the indirect consumption of drinkable water in their residences. Question 3(a–d) asked about the solid waste produced in the volunteer’s residence. Question 4(a–d) aimed to understand people’s beliefs regarding changes in sanitation investments. Questions 5–9 provide an overview of volunteers’ knowledge and awareness about water processes within the place where they live
Table 3. Results of questions asked to volunteers (see ). The results present the average for each variable obtained from the respective questions. *Indicates that water bills were transformed into net present value
Figure 3. Outcomes for blue water footprint (BWF) and grey water footprint (GWF) accounting from the sanitation processes in the case study. (a) BWF from domestic demands; (b) and (c) GWF accounting for domestic wastewater processes; (d) GWF accounting for leachate production within the municipal sanitary landfill. Scenarios in (b) consider that investments in wastewater treatment in 2030 and 2050 will receive the same historical average fraction of municipal GDP in the future, while (c) considers this fraction as indicated by volunteers in question 4 from ; (d) provides possible storylines for GWF considering projections based on time series analyses of solid waste production, answers from volunteers for question 3, in , and projections of climatic variable for scenarios RCP 4.5 and RCP 8.5
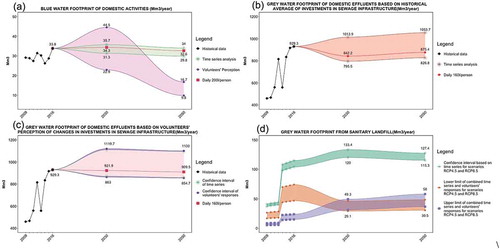
Figure 4. Water security assessment of possible scenarios. The figure breaks down the two components of the water footprint for previous years and provides favourable and unfavourable scenarios for 2030 and 2050. The left-hand y-axis refers to the bar plots, which is the municipal water footprint in Mm3 per year, while the right-hand y-axis refers to the markers, which give the yearly individual water footprint in m3 per capita per year. BWF: blue water footprint; GWF: grey water footprint
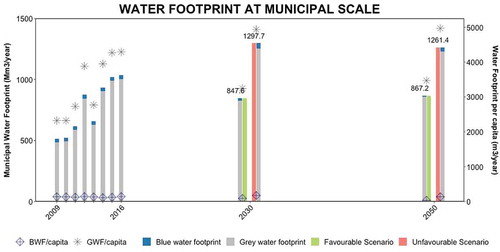
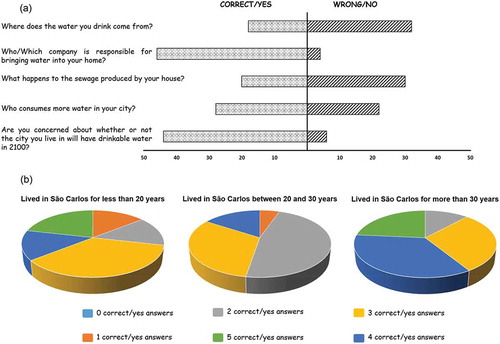
Figure 5. Responses from citizens to qualitative questions, where (a) represents the answers from all volunteers and (b) evaluates the number of answers according to their residence time in the case study