
Figures & data
Figure 1. Annual maximum series of flood flows observed between 1940 and 2015 in the study region (station ID numbers are indicated on the x axis; records are arranged from longest to shortest)
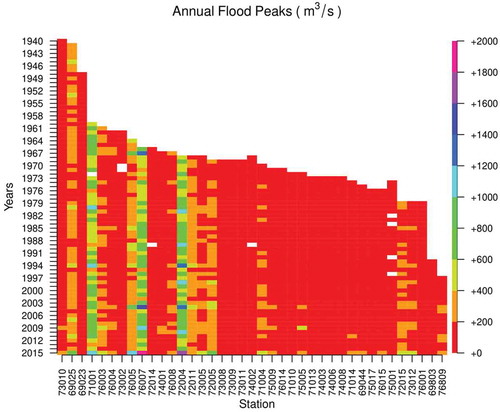
Figure 2. Study area and the location of river gauging stations considered in the study
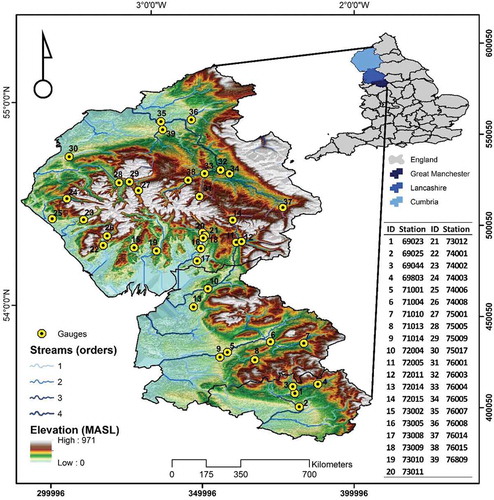
Figure 3. Mann-Kendall test (MKT) and Pettitt test (PT) results in terms of rejection of the null hypothesis (i.e. MKT: presence of a monotonic trend; PT: presence of an abrupt change in the mean) for the study sequences of annual floods (at the 5% significance level)
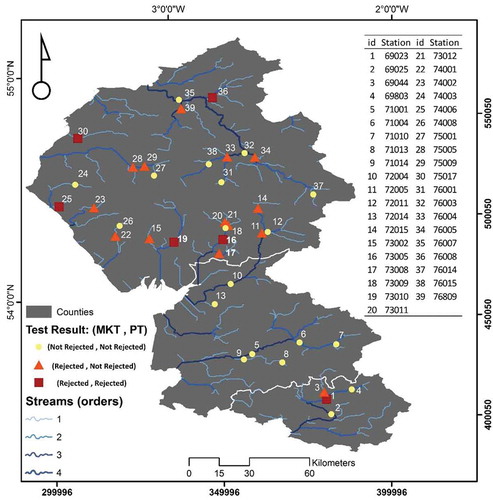
Table 1. Parameters of stationary and non-stationary models estimated by the MLE method for station no. 69044: River Irwell at Bury Ground
Table 2. Parameters of stationary and non-stationary models estimated by the MLE method for station no. 75005: River Derwent at Portinscale
Figure 4. Best-fit distribution model in northwest England, based on the Akaike information criterion (AIC) measure
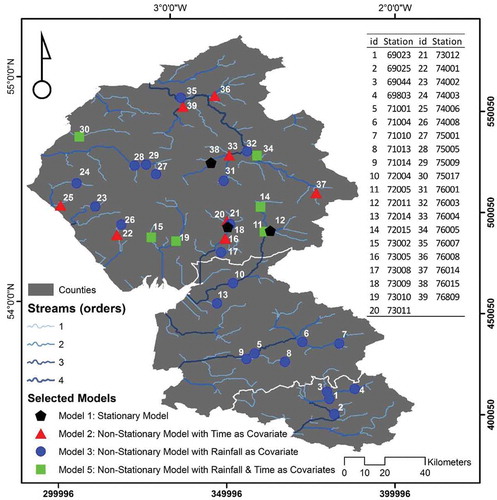
Figure 5. Comparison of the estimated 2-year (median) and 100-year (design) flood quantiles for stationary and best-fit non-stationary model at gauging station Rock (69044)
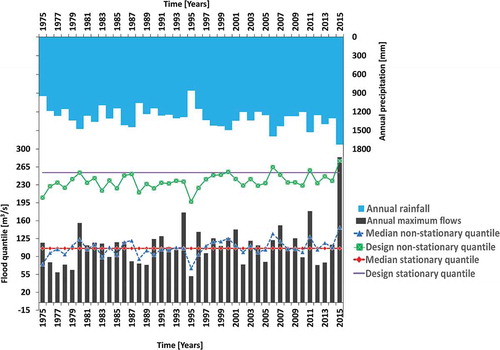
Figure 6. Comparison of the estimated 2-year (median) and 100-year (design) flood quantiles for the stationary and best-fit non-stationary model at gauging station Derwent (75005)
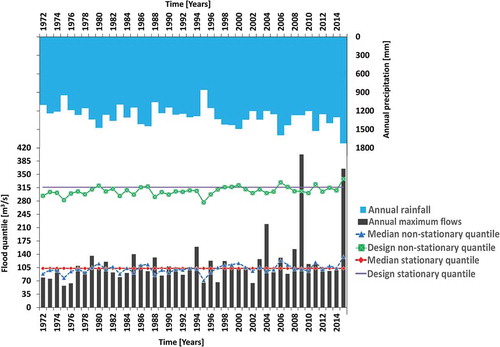
Figure 7. Ratio of the best-fit non-stationary design flood quantile to the stationary one in northwest England in (a) 2015 and (b) 2014. For the stations highlighted in red, the stationary model and the best-fit non-stationary model produce significantly different flood quantile predictions at the 95% confidence level (top right tables list gauging stations and their ID numbers)
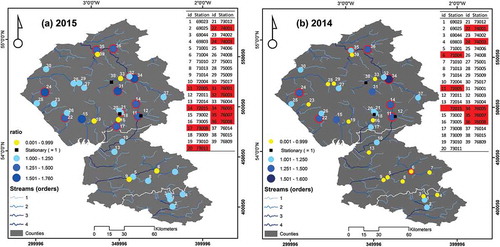
Figure 8. “Trend” map of the design flood quantiles in northwest England in (a) 2015 and (b) 2014, representing how design quantile estimates differ from the stationary estimates (top right tables list gauging stations and their ID numbers)
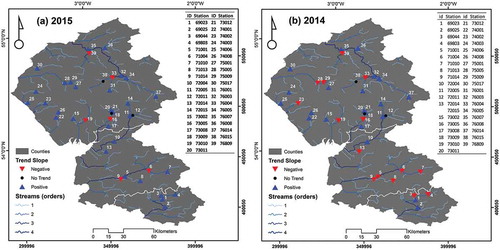
Table A1. Characteristics of all 39 river gauging stations in the study area. AOD: above ordinance datum
Table A2. Estimated (design) flood quantiles for 100-year return periods for 2015 and 2014, along with their 95% confidence intervals