Figures & data
Figure 1. (a) Catchment of Bangong Co; (b) catchment of Dagze Co. The inserts show the locations of Bangong Co and Dagze Co on the Tibetan Plateau
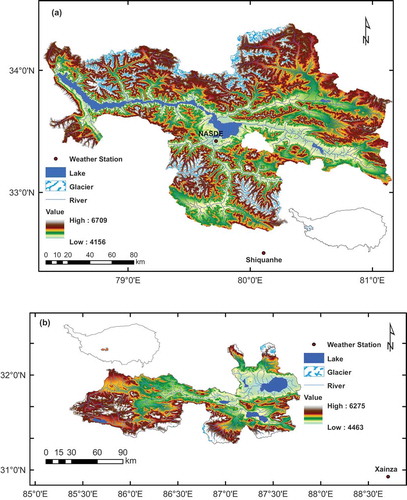
Figure 2. Comparison of Lake Analyzer calculations for (a) metalimnion depth (Depth), (b) lake number (LN), (c) Wedderburn number (W), (d) Schmidt stability (St) and lake water temperature measurements from August 2012 to June 2014 at Bangong Co. (e) shows the isothermals at Bangong Co; numbers represent the lake water temperatures
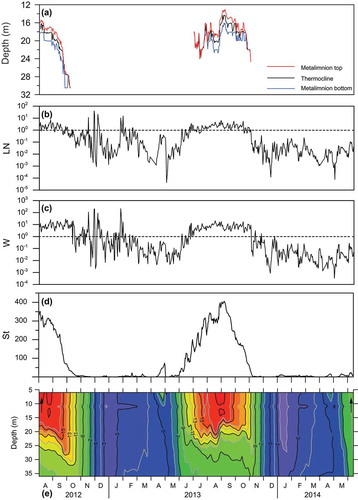
Figure 3. (a) and (b) show the observed temperature variation at 5 m (the uppermost temperature logger, T-5 m, blue line), 35 m (the lowest temperature logger, T-35 m, black line) and 23 m (the average depth of observed metalimnion, T-23 m, red line) during September 2012~May 2013 and September 2013~May 2014, respectively; (c) and (d) show the maximum wind speed during September 2012~May 2013 and September 2013~May 2014, respectively
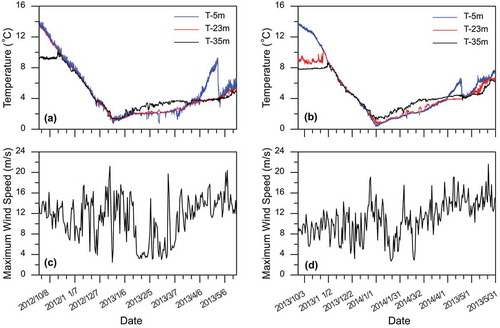
Figure 4. Comparison of Lake Analyzer calculations for (a) metalimnion depth (Depth), (b) lake number (LN), (c) Wedderburn number (W), (d) Schmidt stability (St) and lake water temperature measurements from August 2012 to July 2015 at Dagze Co. (e) shows the isothermals at Dagze Co; numbers represent the lake water temperatures
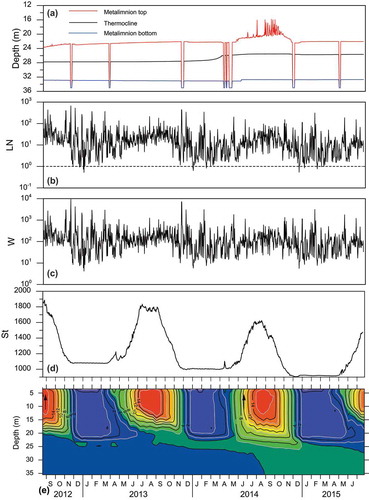
Figure 5. Comparison of extreme wind speed and lake water temperature variations within the mixolimnion at Dagze Co. (a), (c) and (e) represent extreme wind speed at Xainza weather station during September 2012~June 2013, September 2013~June 2014 and September 2014~June 2015, respectively; (b), (d) and (f) show temperature variations at 4 m (blue line), 10 m (red line) and 19 m (black line) within the mixolimnion during September 2012~June 2013, September 2013~June 2014 and September 2014~June 2015. A clear overturn occurred in April 2014 which coincided with the occurrence of stronger wind
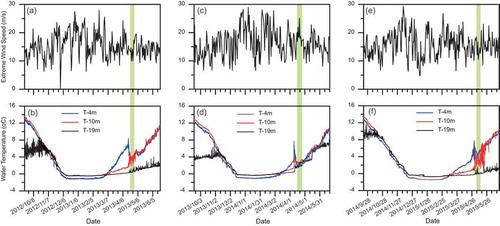
Figure 6. Comparison of the average wind speed, daily mean temperature, and temperature variation at Bangong Co from August 2012 to June 2014. (a) Average wind speed and (b) daily mean temperature at Shiquanhe weather station. (c) The isothermals at Bangong Co; numbers represent the lake water temperatures, as in
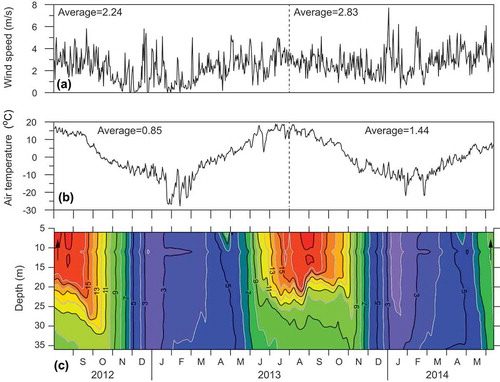
Figure 7. Comparison of meteorological parameters at Xainza station with temperature variation at Dagze Co from August 2012 to July 2015. (a) Average wind speed, (b) daily mean temperature, and (c) daily precipitation at Xainza. (d) The isothermals at Dagze Co; numbers represent the lake water temperatures
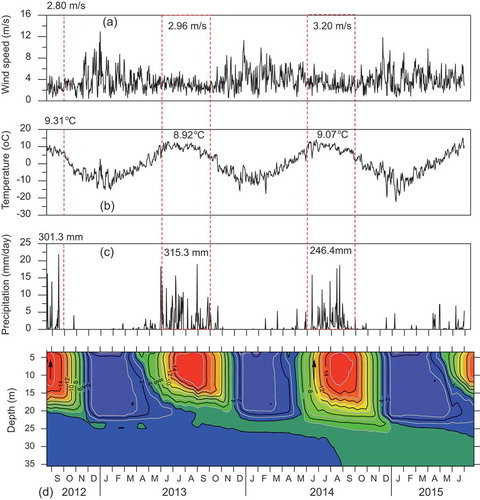
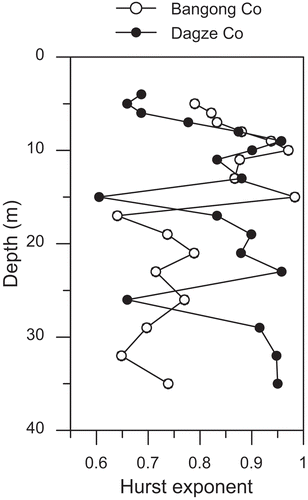
Figure 8. Hurst exponent calculated from rescaled range (R/S) analysis of observed temperatures at Bangong Co (open circles) and Dagze Co (solid circles)