Figures & data
Figure 1. The Hérault River catchment
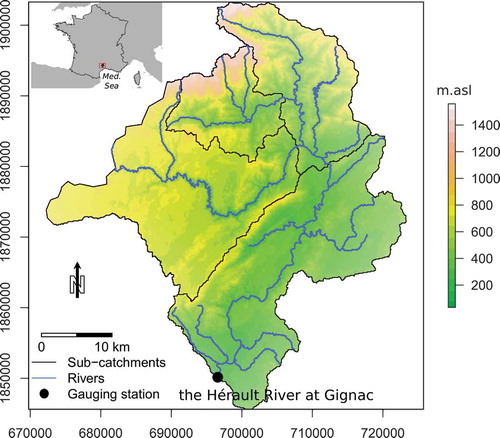
Table 1. Matrix of available general circulation model/regional climate model (GCM/RCM) couples
Figure 2. Flowchart of the cascade of uncertainties, based on the method used in this study
Figure 3. Expected changes and uncertainties in the spline fit to the 30-year rolling mean seasonal precipitation: grand ensemble mean expected trend with 90% confidence intervals in (a) autumn (September–November), (b) winter (December–February), (c) spring (March–May) and (d) summer (June–August). The contribution of each uncertainty source to the total uncertainty is indicated by the different colour bands. Res. Var.: residual variability; Int. Variab.: internal variability
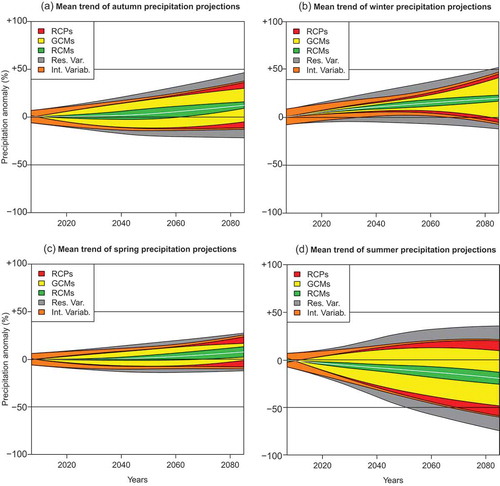
Figure 4. Expected changes and uncertainties in low flows (spline fit to the 30-year rolling mean of the yearly mean annual 7-d minimum flow, MAM7): (a) 90% confidence intervals of the mean change, and (b) relative contribution of the different uncertainty sources to the total uncertainty. Hydro. Par.: hydrological model parameters; Res. Var.: residual variability; Int. Variab.: internal variability. Control period: 1976–2005
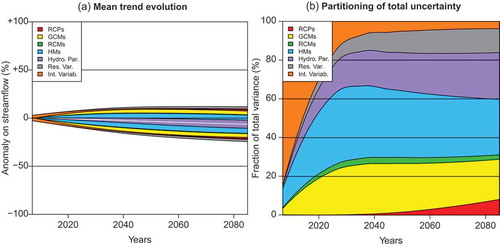
Figure 5. Expected changes and uncertainties in high flows (spline fit to the 30-year rolling mean of the yearly Q95): (a) 90% confidence intervals of the mean change, and (b) relative contribution of the different uncertainty sources to the total uncertainty. Hydro. Par.: hydrological model parameters; Res. Var.: residual variability; Int. Variab.: internal variability. Control period: 1976–2005
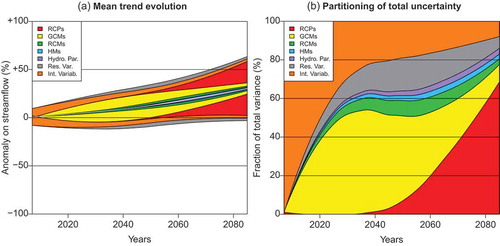
Figure 6. Main effects of the different RCPs (left column), GCMs (middle column), and RCMs (right column) on climatic projection changes for projections of annual temperature (a, b, c), autumn precipitation (d, e, f), spring precipitation (g, h, i), summer precipitation (j, k, l), and annual PET (m, n, o). Solid lines represent the mean effect of each climate scenario or model; the 90% confidence interval of QUALYPSO estimations is drawn in shaded color
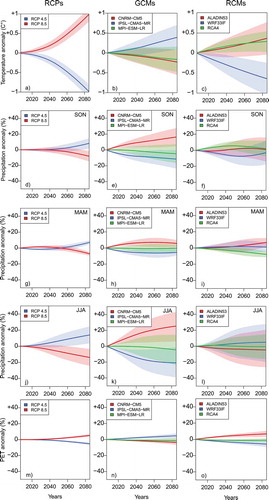
Figure 7. Main effects on hydrological projections of RCPs, GCMs, RCMs, HMs, and hydrological model parameters on high flow (a, b, c, d, e) and low flow (f, g, h, i, j) projections. Solid lines represent the mean effect of each climate scenario or model; the 90% confidence interval of QUALYPSO estimations is drawn in shaded colour. For parameters, each line represents a parameter set calibrated on a specific period for the three HMs
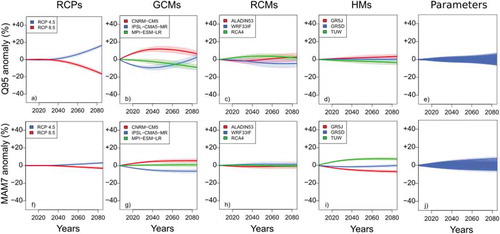
Figure 8. Comparison of flow-duration curves on a logarithmic scale for observations and simulations of the reference period (1976–2005), for the 10th and 90th percentiles of the simulation ensembles
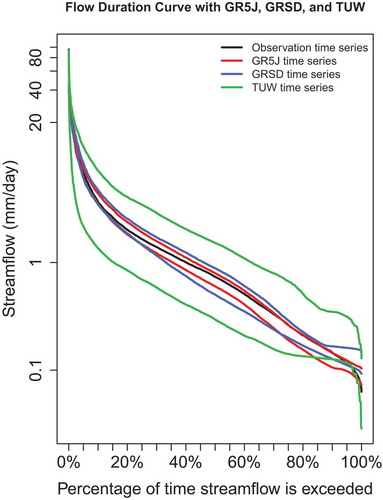
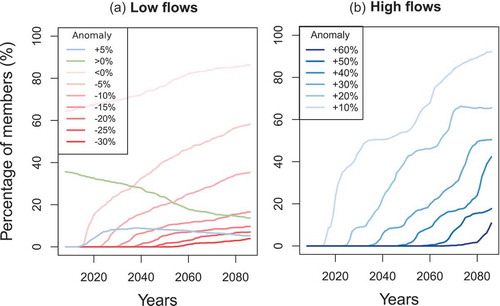
Figure 9. Proportion of projections showing an anomaly, for (a) low-flow and (b) high-flow projections