Figures & data
Figure 1. Location of the study sub-catchments with topography (upper panel), stream network, monitoring stations and long-term annual rainfall (lower panel)
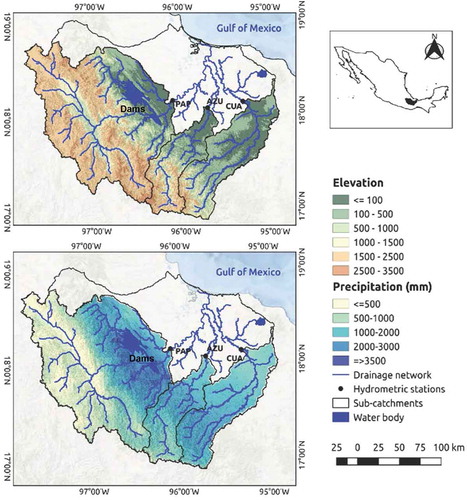
Table 1. Summary of the physical and hydroclimatic characteristics of the study sub-catchments
Figure 2. The erosion and geological classes of the study catchment
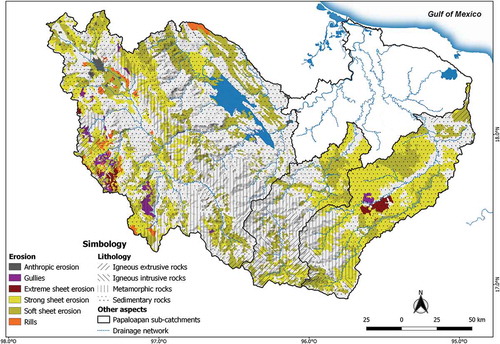
Figure 3. Workflow of land cover and use change analyses
Figure 4. The eight hysteresis classes (after Zuecco et al. Citation2016) according to the hysteresis index (HI) value signs and the suspended sediment concentration (SSC) increase/decrease from the initial state, to show general directions and shapes. The x-axis displays HI values whereas the y-axis shows SSC values
Table 2. Summary of the principal characteristics according to each hysteresis type
Table 3. Land cover per area (km2) for each period and sub-catchment
Figure 5. The study catchment land cover sequence from 1986, 1993 and 1998, together with a bar chart showing the rate of change per land cover class
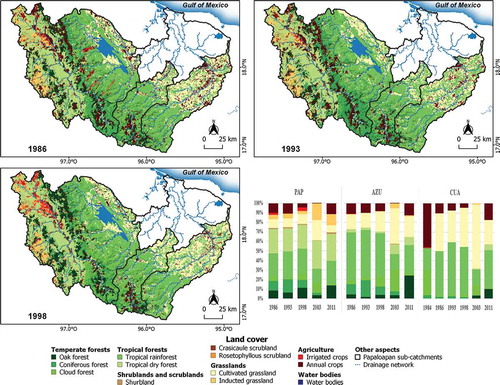
Figure 6. Inter-annual monthly hydroclimatic regimes for each subcatchment. Q: discharge (left y-axis), SSC: suspended sediment concentration (right y-axis)
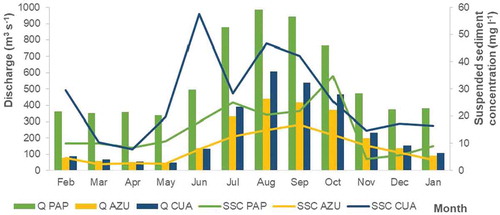
Table 4. Statistical trend tests applied to the sediment mass flux time series
Figure 7. Monthly time series of discharge, suspended sediment concentration ((bottom black lines)) and sediment flux (top black lines) in the three sub-catchments. The dates and p values highlight the trend inflection point suggested by Pettitt’s test
Figure 8. Monthly suspended sediment concentration–discharge hysteresis loops. Numbers in each loop indicate the corresponding month. Arrows highlight the loop direction
Figure 9. Annual hysteresis index values and types. h: hysteresis index value; Roman numerals indicate hysteresis types