
Figures & data
Figure 1. The Beas-Sutlej river basin, India
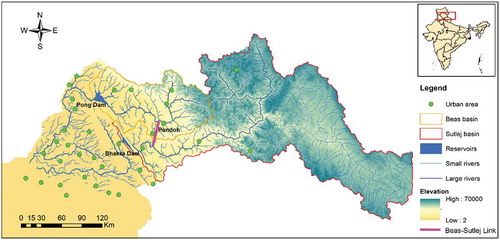
Figure 2. Schematic diagram of the research methodology
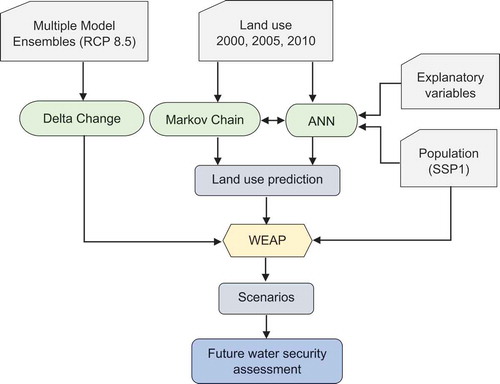
Table 1. List of Coupled Model Intercomparison Project Phase 5 (CMIP5) climate models used
Table 2. Inputs and outputs for the Water Evaluation and Planning (WEAP) model
Figure 3. Schematic of the WEAP model for the Beas-Sutlej river basin, India
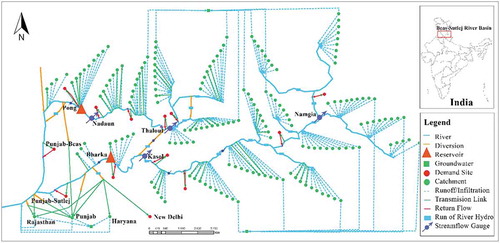
Table 3. Scenario testing for water security in the Beas-Sutlej river basin
Figure 4. Monthly projections and annual changes for (a) precipitation and (b) temperature in the upstream of the Himalayas
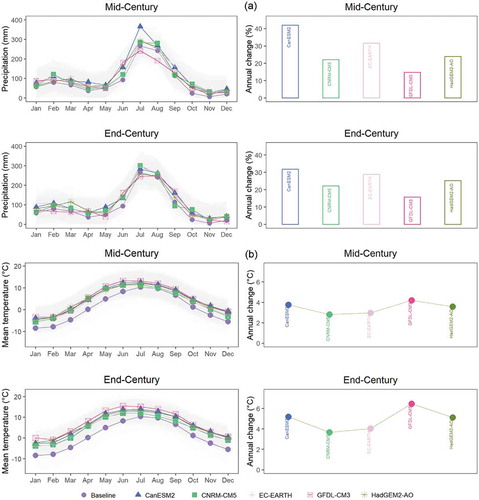
Figure 5. Ensemble mean of monthly (a) rainfall (dotted lines are the baseline) and (b) maximum and minimum temperature in irrigated areas
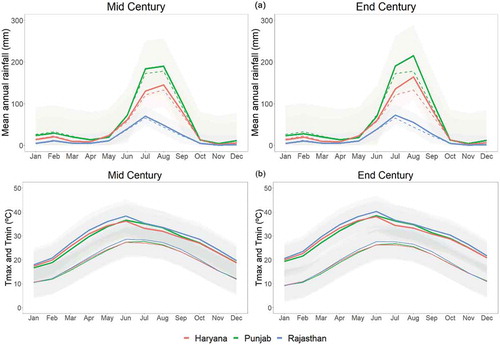
Figure 6. Projected population under SSP1 in the Beas-Sutlej river basin
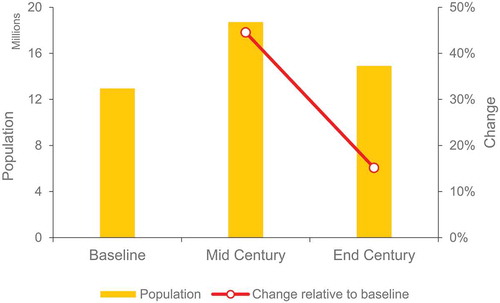
Table 4. Explanatory variables for land use change projection
Table 5. Observed and simulated land use
Figure 7. Land use changes for mid- and end-century
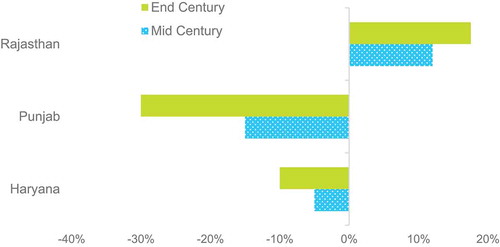
Figure 8. Simulated and observed monthly streamflow during calibration and validation
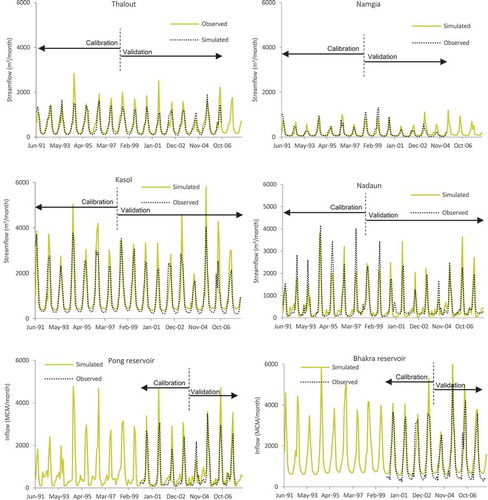
Table 6. Runoff generations in the Beas and Sutlej rivers measured at the Pong and Bhakra reservoirs
Figure 9. Mean of the projected irrigation water demand for different scenarios
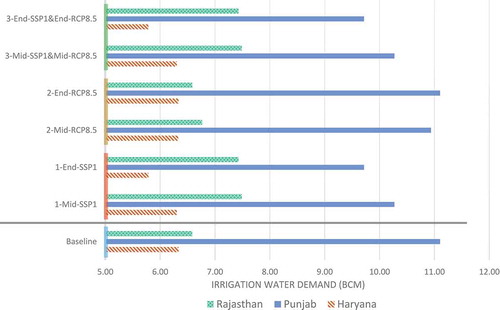
Figure 10. Performance indices for irrigation water allocation at (a) mid-century and (b) end-century based on different scenarios
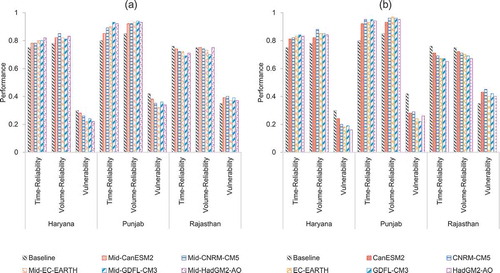
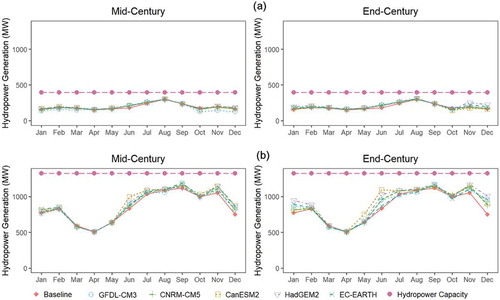
Figure 11. Hydropower generation at the (a) Pong and (b) Bhakra reservoirs for different scenarios
Data availability
The data that support the findings of this study are openly available in [4TU.Research Data] at http://doi.org/10.4121/uuid:b55e1df0-7dd2-4c25-bb26-54fe1121f7c8.