
Figures & data
Figure 1. Location of the 8- and 18-year-old apple orchards in the Wangdonggou watershed on the Loess Plateau of China
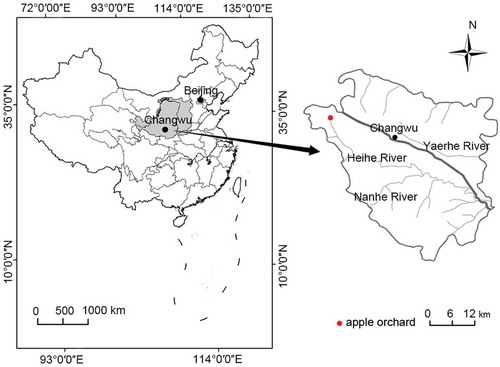
Figure 2. Variation of precipitation (P), solar radiation (Rs), air temperature (AT), wind speed (Ws), relative humidity (RH), vapour pressure deficit (VPD) and daily reference evapotranspiration (ET0) in 2013, 2014, 2015 and 2016
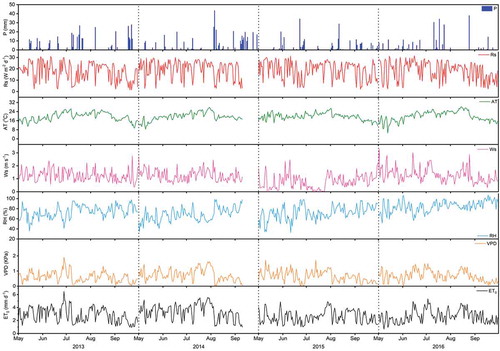
Table 1. Numbers of sample trees and frequencies of trees in four diameter classes in the 8- and 18-year-old orchards
Figure 3. Variation of monthly leaf area index (LAI) of the 8- and 18-year-old apple orchards in 2013, 2014, 2015 and 2016
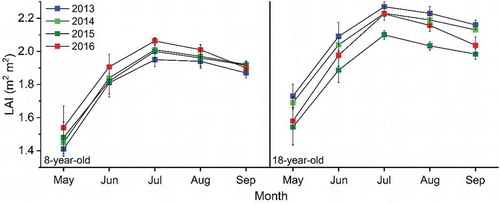
Figure 4. Relative extractable water (REW) at 0–600 cm in the 8-year-old and 18-year-old apple orchards in 2013, 2014, 2015 and 2016. The dot line indicates the threshold of soil water deficits
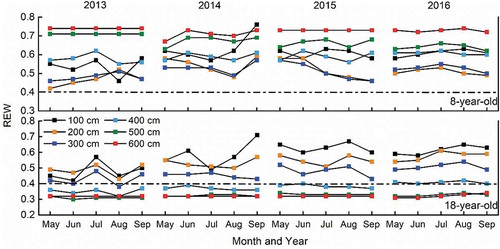
Figure 5. Daily transpiration in the 8- and 18-year-old apple orchards and differences (18 years minus 8 years) between the two orchards in 2013, 2014, 2015 and 2016
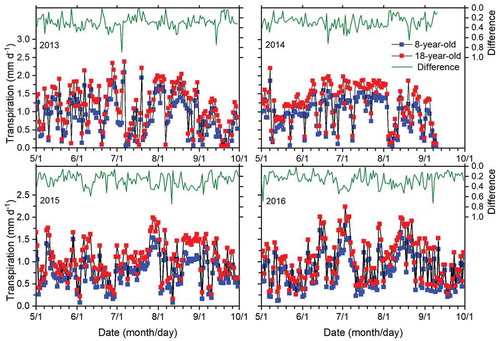
Figure 6. Daily mean transpiration in the 8- and 18-year-old apple orchards in 2013, 2014, 2015 and 2016. The same capital letters indicate no significant difference according to the least significant difference (LSD0.05) test. The error bars indicate the coefficient of variation of daily mean transpiration in each year
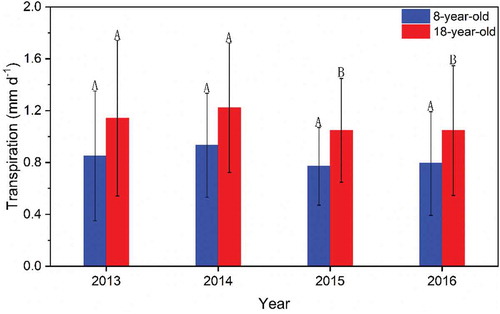
Table 2. Pearson correlation and partial correlation coefficients between daily sap flow velocity, meteorological factors and ET0 for the 8- and 18-year-old apple orchards for 2013, 2014, 2015 and 2016
Figure 7. Daily sap flow velocity of the 8- and 18-year-old apple orchards and differences (8 years minus 18 years) between the two orchards in 2013, 2014, 2015 and 2016
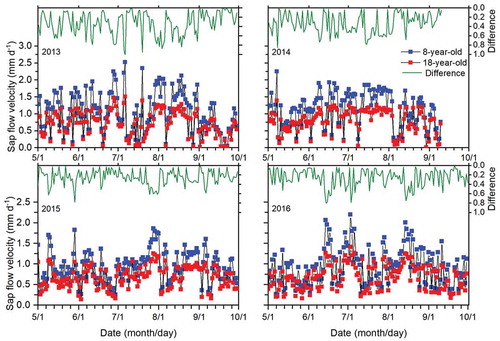
Table 3. Multivariate regression models for daily sap flow velocity in the 8- and 18-year-old apple orchards during the growing season of 2013–2016
Table 4. Characteristics of monthly transpiration for the 8- and 18-year-old apple orchards in 2013, 2014, 2015 and 2016
Figure 8. Monthly total precipitation (P), transpiration (T) and differences (P minus T) for the 8- and 18-year-old apple orchards in 2013, 2014, 2015 and 2016
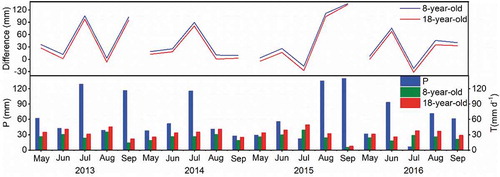
Table 5. Annual precipitation, transpiration and the ratio of transpiration to precipitation for the 8- and 18-year-old apple orchards in 2013, 2014, 2015 and 2016