
Figures & data
Figure 1. Purus river basin
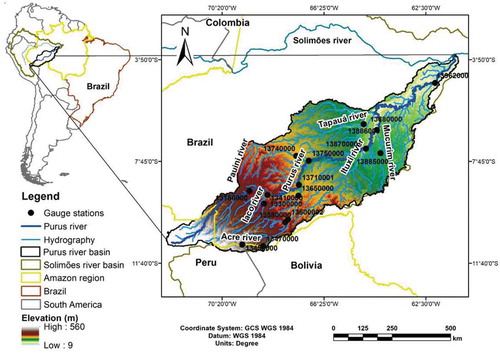
Table 1. Bankfull width (W) and depth (D) obtained for the cross-sections of river gauge stations located in the Purus River basin
Table 2. Efficiency metrics used in this study
Table 3. Hydraulic geometry relationships obtained for the Purus River basin
Figure 2. Hydrologically homogeneous regions (HHR) obtained for the Purus River basin
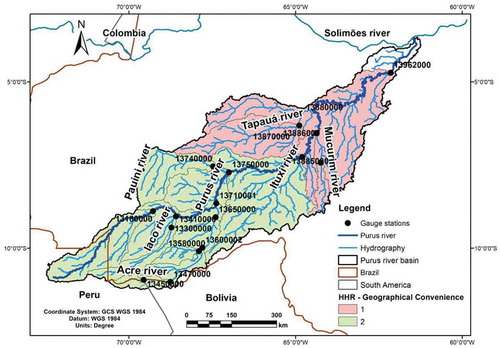
Table 4. Efficiency metrics for the comparison between width and depth data obtained by different methods and observed data from gauge stations in the Purus River basin
Figure 3. Dispersion diagrams between observed and estimated bankfull widths and depths
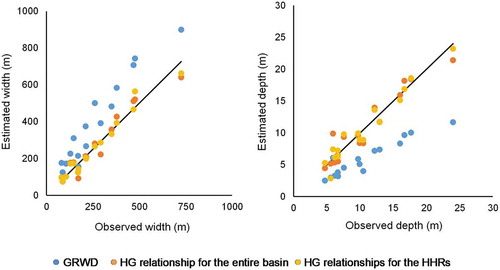
Figure 4. Difference between the performances of MGB SA for streamflow metrics using GRWD data and using HG relationships for HHRs for the Purus River basin
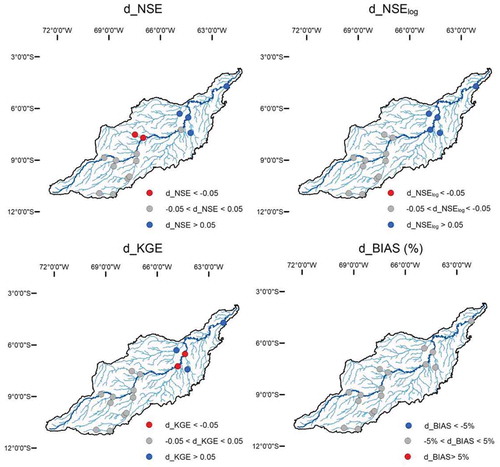
Table 5. Streamflow metrics using GRWD data and using HG relationships for HHRs for the Purus River basin
Figure 5. Comparison between streamflow simulated using geomorphological data from GRWD and from HG relationships with streamflow observed in the gauge stations in the Purus River basin
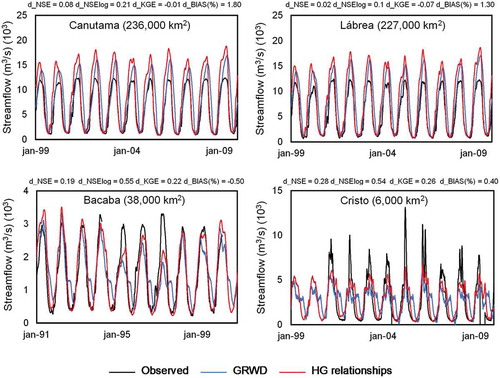
Figure 6. Difference between MGB SA performance for water level metrics (anomaly) using GRWD data and HG relationships for HHRs of the Purus River basin
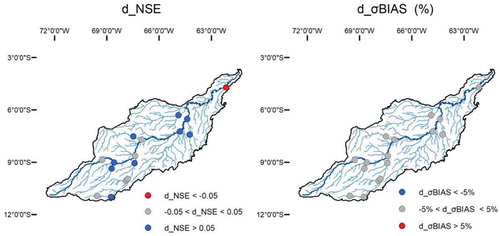
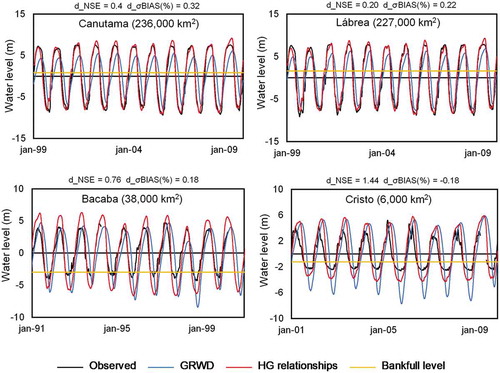
Figure 7. Comparison between anomalies simulated using GRWD data and HG relationships with observed anomalies from Purus River basin gauge stations
Data availability statement
Some or all data, models, or codes that support the findings of this study are available from the corresponding authors upon reasonable request.