Figures & data
Figure 1. Workflow showing the sequence of steps involved in estimating the indicator. Arrows represent the order of processes
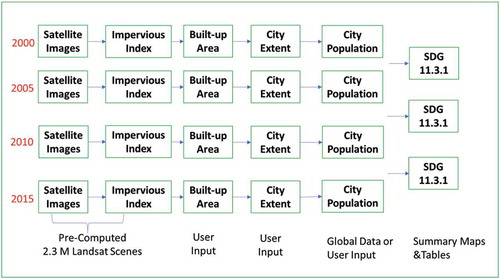
Figure 2. Hamilton city urban area in 2000, 2005, 2010 and 2015, with city boundary
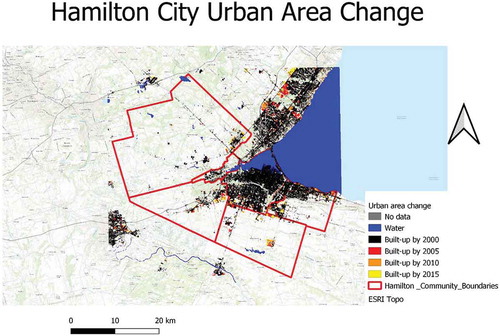
Figure 3. Zoomed-in urban area (city core) shown in red for (a) 2000 and (b) 2015
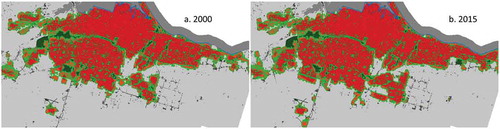
Table 1. Urban area and population, 2000–2015
Table 2. Population growth rate and land consumption rate in the three study periods
Figure 4. Summary of the SDG 11.3.1 indicator for different periods (source: output from (Trends.Earth Citation2018)
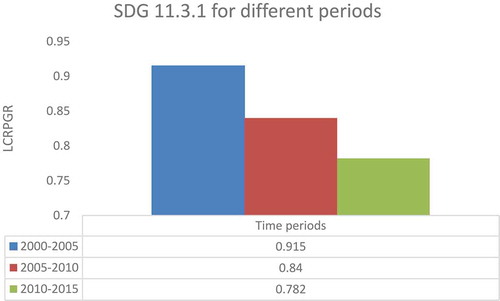
Table 3. Land consumption per capita for the study years
Table 4. Summary of land consumption per capita (LCPC) and the total change in urban infill
Figure 5. Total annual precipitation for Hamilton,in 1948–2019
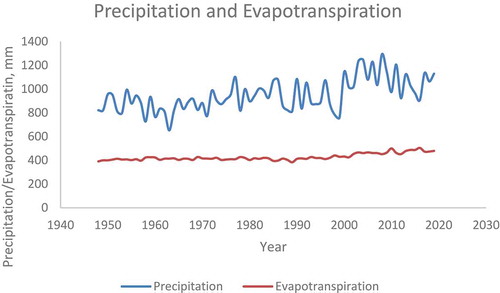
Table 5. Percentage change in precipitation intensity from the intensity-duration frequency curve, with climate projections
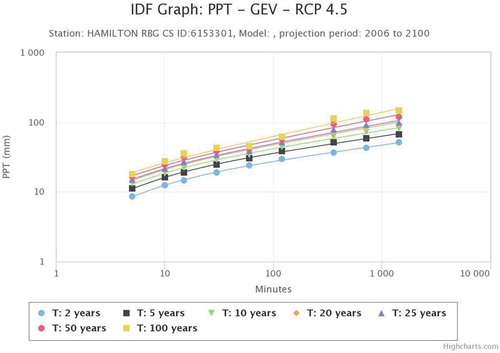
Figure 6. Intensity-duration-frequency (IDF) graph based on historical precipitation (PPT) data using generalized extreme value (GEV) distribution (source IDF_CC Tool Citation2018)
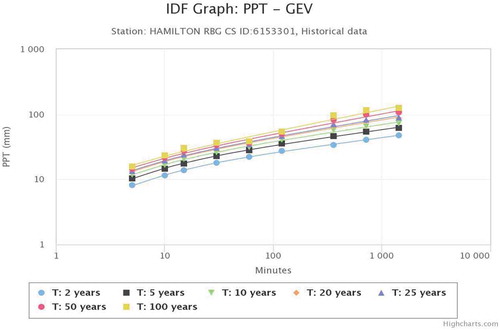
Figure 7. Intensity-duration-frequency (IDF) curve based on climate-projected PPT data (RCP 4.5) using generalized extreme value (GEV) distribution (source (IDF_CC Tool Citation2018)