602
Views
9
CrossRef citations to date
0
Altmetric
Research Article

Quantifying relative contribution of land use change and climate change to streamflow alteration in the Bengawan Solo River, Indonesia

ORCID Icon, ORCID Icon & ORCID Icon
Pages 1059-1068 | Received 11 Oct 2020, Accepted 16 Mar 2021, Published online: 20 May 2021

Figures & data

Table 1. Catchment characteristics of the study area

Figure 1. Location of the Bengawan Solo catchment and the distribution of gauges. The catchments marked in yellow are part of the study area

Figure 1. Location of the Bengawan Solo catchment and the distribution of gauges. The catchments marked in yellow are part of the study area

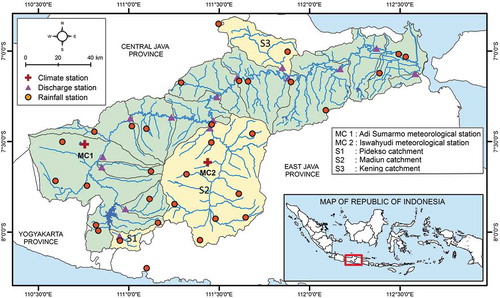
Table 2. Hydrological characteristics of the study area

Figure 2. Tomer and Schilling’s (Citation2009) framework, adapted after Marhaento (Citation2018), illustrating how the fractions of excess water (Pex) and excess energy (Eex) respond to climate change and land use change. The points M1 and M2 are the fractions of excess water and energy forir the baseline period (Eex1, Pex1) and the altered period (Eex2,Pex2), respectively. The resultant length (R) is the magnitude of the combined influence of land use change and climate change

Figure 2. Tomer and Schilling’s (Citation2009) framework, adapted after Marhaento (Citation2018), illustrating how the fractions of excess water (Pex) and excess energy (Eex) respond to climate change and land use change. The points M1 and M2 are the fractions of excess water and energy forir the baseline period (Eex1, Pex1) and the altered period (Eex2,Pex2), respectively. The resultant length (R) is the magnitude of the combined influence of land use change and climate change

Table 3. Calculation of the contribution of land use change and climate change to streamflow alteration in the study catchments

Figure 3. Change of excess water (Pex) and excess energy (Eex) from the baseline period (B) to the altered period (A) relative to the aridity index (AI) for (a) the Pidekso catchment, (b) the Madiun catchment, and (c) the Kening catchment

Figure 3. Change of excess water (Pex) and excess energy (Eex) from the baseline period (B) to the altered period (A) relative to the aridity index (AI) for (a) the Pidekso catchment, (b) the Madiun catchment, and (c) the Kening catchment

Table 4. The results of the Mann-Kendall trend test and Sen’s slope estimator for annual rainfall and potential evapotranspiration in three catchments

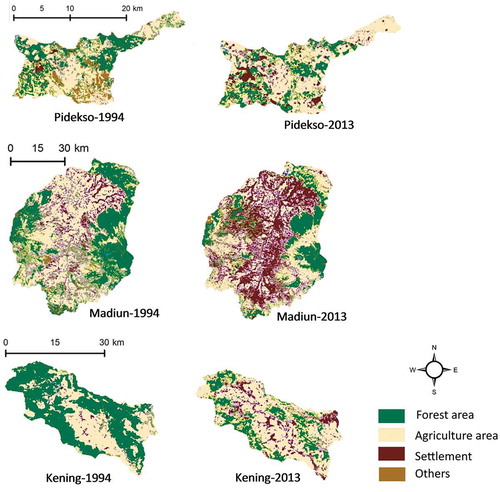
Table 5. Land use distribution (in km2) in the three catchments for the years 1994 and 2013, and changes (in %)

Figure 4. Land use maps for the study catchments for the years 1994 and 2013

Figure 4. Land use maps for the study catchments for the years 1994 and 2013

Reprints and Corporate Permissions

Please note: Selecting permissions does not provide access to the full text of the article, please see our help page How do I view content?

To request a reprint or corporate permissions for this article, please click on the relevant link below:

Academic Permissions

Please note: Selecting permissions does not provide access to the full text of the article, please see our help page How do I view content?

Obtain permissions instantly via Rightslink by clicking on the button below:

If you are unable to obtain permissions via Rightslink, please complete and submit this Permissions form. For more information, please visit our Permissions help page.