
Figures & data
Table 1. Stand structure of each tray before and after thinning
Figure 1. Arrangement of Trays 1, 2 and 3 before thinning. Note that Tray 1 and Tray 2 were inclined so rainwater drained. In Trays 1 and 2, the height difference between the front right corner and far left corner where the drains were made was ~10 cm
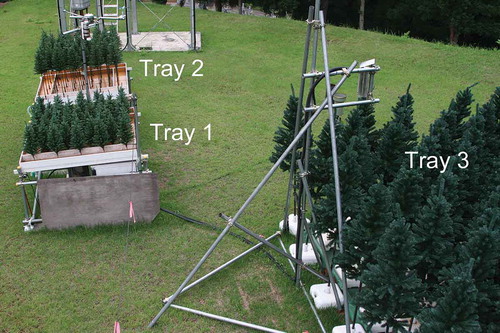
Table 2. Gross rainfall (PG) and net rainfall (PN) for each tray on a rain event basis
Figure 2. Relationship between gross rainfall PG and observed canopy interception during rainfall IR, during storm break time ISbt and after cessation of rainfall IAft, on a rain event basis. (a) Tray 1 (control), (b) Tray 2 before thinning, (c) Tray 3 before thinning; (d) Tray 1 (control); (e) Tray 2 after thinning, (f) Tray 3 after thinning. In panel (c) for the largest PG of 110.2 mm, the sum of I3R and I3Sbt is shown due to the clogged drain
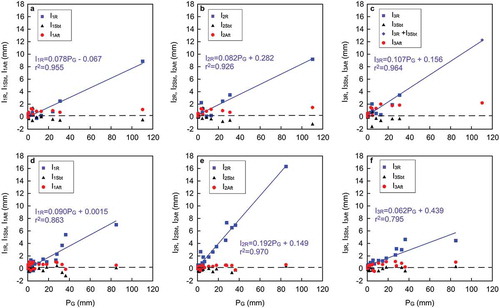
Table 3. Amount of rainfall and canopy interception before and after thinning for each tray
Figure 3. Observed and calculated canopy interception during rainfall (respectively, IR and IR_PM) and during storm break time (respectively, ISbt and ISbt_PM), against gross rainfall PG. (a) Tray 1 (control), (b) Tray 2 before thinning, (c) Tray 3 before thinning; (d) Tray 1 (control), (e) Tray 2 after thinning, (f) Tray 3 after thinning. Observed values and regression lines are the same as those in Fig. 2
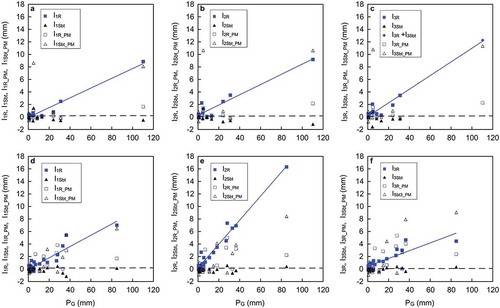
Table 4. Amount of rainfall and canopy interception during four heavy rain events. Each value represents the total amount, although the sum operator is omitted
Figure 4. (a–d) Gross rainfall for the i-th sub-rain event PGi and observed canopy interception during rainfall for the sub-rain event IjRi in Tray j for four heavy rain events. (e–h) Calculated canopy interception during rainfall for the i-th sub-rain event IjR_PMi and that of observed IjRi for four heavy rain events in Tray j. (a) and (e) Rain Event 1 with total gross rainfall (PG) of 110.2 mm before thinning period; (b) and (f) Rain Event 2 with PG of 31.0 mm before thinning period; (c) and (g) Rain Event 3 with PG of 36.4 mm after thinning period; (d) and (h) Rain Event 4 with PG of 84.9 mm after thinning period
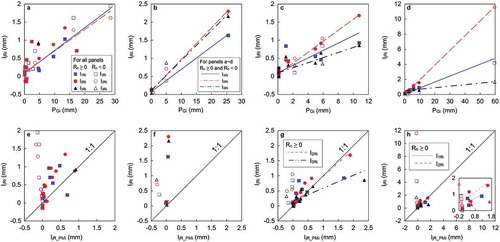
Figure 5. Observed canopy interception during storm break time IjSbti and calculated IjSbt_PMi on a storm break time basis in Tray j. (a) Rain Event 1 before thinning period; (b) Rain Event 2 before thinning period; (c) Rain Event 3 after thinning period; (d) Rain Event 4 after thinning period
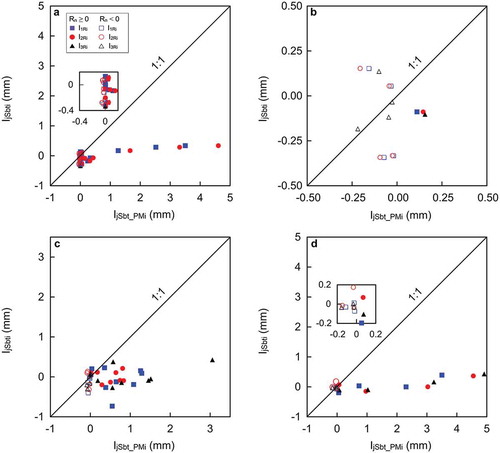
Figure 6. Time series of water budget, canopy interception and meteorological elements for Rain Event 1 with total gross rainfall PG of 110.2 mm, before thinning: (a) PG; (b) canopy storage S; (c) observed cumulative IjRi; (d) calculated cumulative IjR_PMi; (e) observed cumulative IjSbti; (f) calculated cumulative IjSbt_PMi; (g) calculated potential evaporation EPM; (h) net radiation Rn; (i) relative humidity RH; (j) air temperature Ta; (k) wind speed u. Unit of ordinates is mm unless otherwise indicated
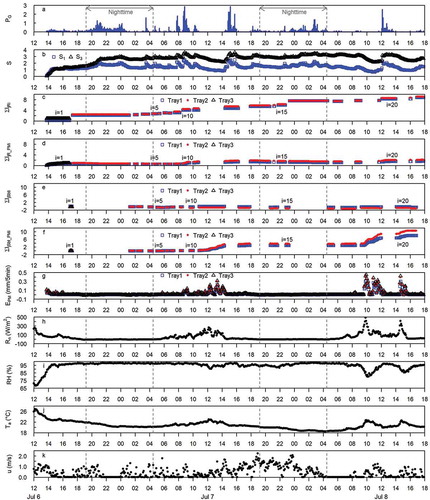
Figure 7. Time series of water budget, evaporation and meteorological elements for Rain Event 4 with total gross rainfall PG of 84.9 mm, after thinning; details on each panel are the same as in Fig. 6
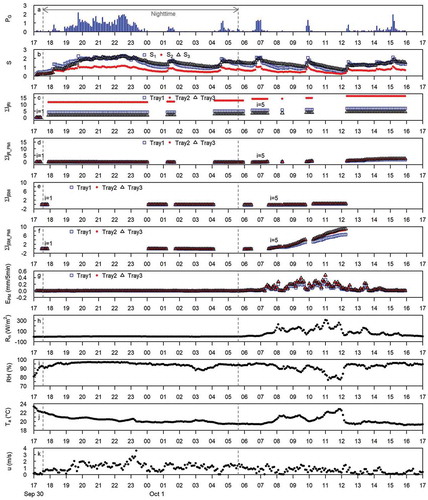
Figure 8. Dependence of lifetime for small droplets on relative humidity (RH) and air temperature. (a) RH = 95%; (b) RH = 99%
Table B1. List of acronyms, abbreviations and symbols