Figures & data
Figure 1. On the right (inset) Brazil is shown with the state Ceará (red) and the study area (green). The larger map shows the study area and its location in the Banabuiú catchment. For the study area, a digital elevation map is shown as well as the studied reservoirs with their drainage areas, gauging station Senador Pompeu and some (main) rivers
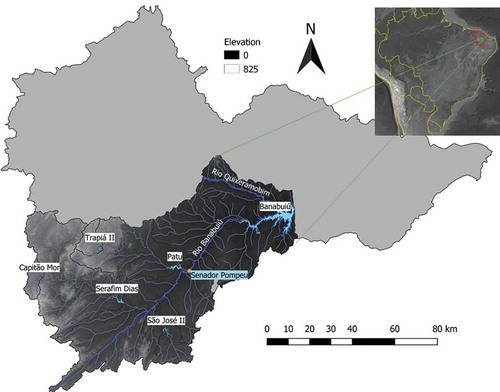
Table 1. Reservoir capacity and drainage area (see for their locations). The incremental drainage areas are used for precipitation data and the total drainage area is used in the downstreamness analysis
Table 2. Monthly datasets used for analysis (FUNCEME, Citation2019, ANA, Citation2019)
Table 3. Drought Categories (McKee et al. Citation1993)
Figure 2. Schematic depiction of three situations of reservoir filling rates for a river basin with two reservoirs: (a) if the filling rates are equal, the downstreamness of the stored volume (DSV) equals the downstreamness of storage capacity (DSC); (b) if the filling rate of the upstream reservoir is greater than that of the downstream reservoir, DSV is less than DSC; and (c) if the filling rate of the upstream reservoir is less than that in the downstream reservoir, DSV is greater than DSC. Reprinted from Van Oel et al. (Citation2018)
Figure 3. (a) Total annual precipitation of the incremental basins of the reservoirs and the gauging station (Senador Pompeu), showing wetter and drier years and some variability between the areas; and (b) climatology of the incremental basins as average precipitation per month, showing the wet and dry seasons
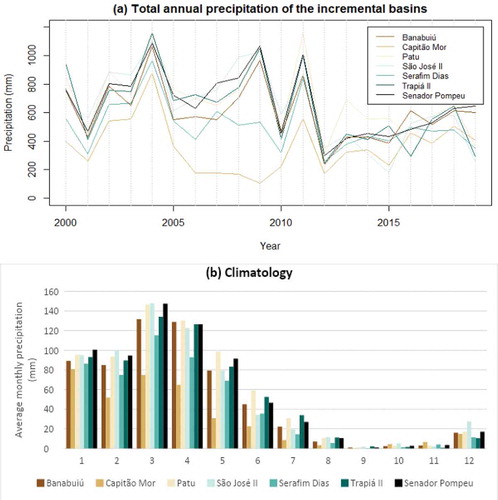
Figure 4. Box plot of the total monthly incremental precipitation; the black dots represent the mean. Capitão Mor stands out because of the lower values in general
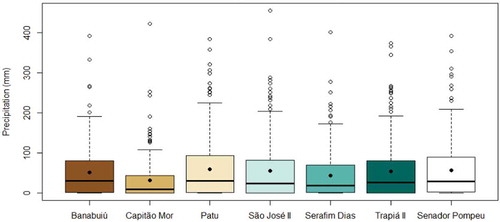
Figure 5. SPI-12 of the incremental basins of the reservoirs and Senador Pompeu gauging station; the horizontal lines represent the upper limits of the drought categories as given in
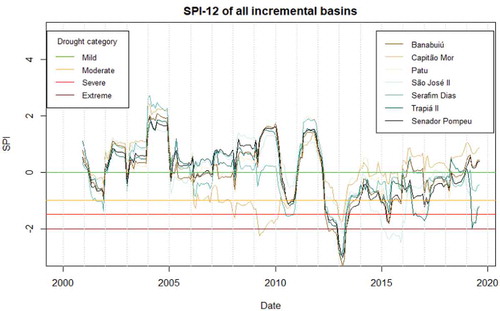
Figure 6. Average monthly streamflow (m3/s) at the Senador Pompeu gauging station, with the total monthly precipitation (mm) in blue
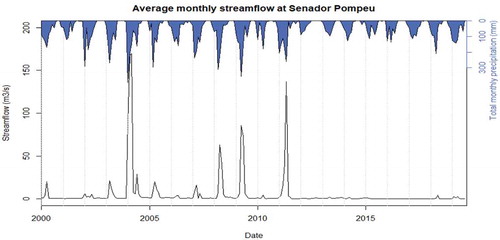
Table 4. Statistical summary of the monthly streamflow data
Figure 7. SSI-12 of the Senador Pompeu gauging station; the horizontal lines represent the upper limits of the drought categories as given in
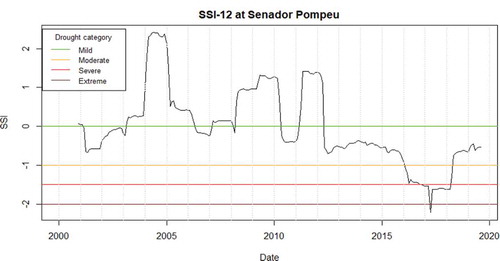
Figure 8. Daily reservoir volumes (hm3) and the inserted values for the missing data, calculated through linear interpolation. In the title above each graph, the percentage of missing data points is given
Figure 9. Percentage of the reservoirs that is filled on the last day of the month. The driest periods are of interest for this study, specifically the one starting in 2011–2012. Note the difference in time it takes for the reservoirs to be depleted and the steepness of the graphs from this point
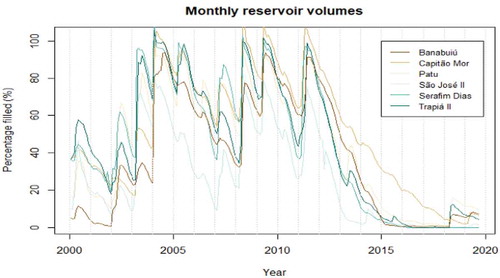
Figure 10. Box plots of reservoir volumes; the black dots represent the mean (2000–2019). The values range from approximately zero to the reservoir capacity
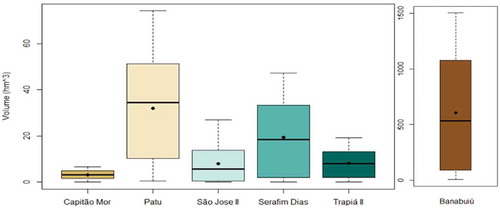
Figure 11. SRSI-12 of the reservoirs; the horizontal lines represent the upper limits of the drought categories as given in . More information about the drought onset and magnitude is given in
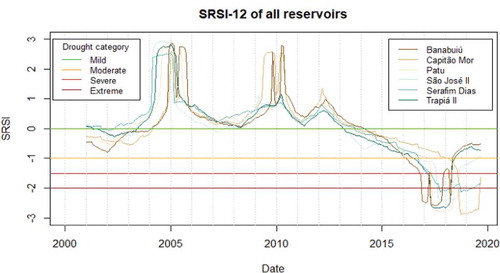
Table 5. SRSI drought onset, peak and magnitude. The drought peak gives the moment when the lowest SRSI value is reached. These values were always below −2, indicating an extreme drought
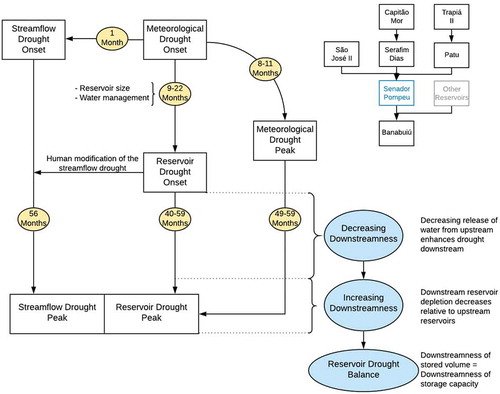
Figure 12. Drought periods for comparing meteorological to hydrological drought, ordered following the flow directions shown in the flowchart on the right (water flows downward). Note the time between the drought onsets and drought peaks (see also )
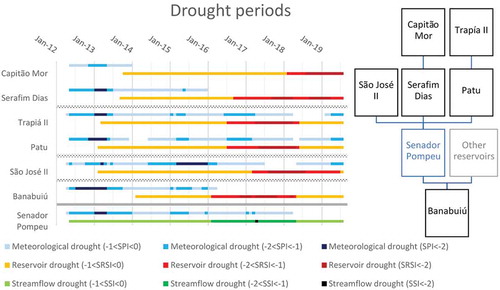
Table 6. Time lags between SPI and SRSI/SSI for the start of the drought and the minimum value
Table 7. Downstreamness of the reservoirs relative to the Senador Pompeu gauging station and relative to Banabuiú reservoir and their capacities
Figure 13. Downstreamness of storage volume (black line) and capacity (grey horizontal line) relative to (a) the Senador Pompeu gauging station (Banabuiú reservoir not included) and (b) Banabuiú reservoir
Figure 14. Comparing reservoir drought to downstreamness, a combination of and 13 (again (a) excluding and (b) including Banabuiú reservoir)
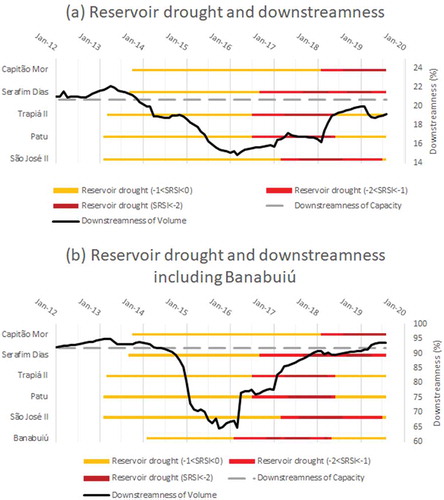
Figure 15. Downstreamness of storage volume (black line) and capacity (grey horizontal line) relative to (a) the Senador Pompeu gauging station of the Capitão Mor-Serafim Dias cluster and (b)the Patu-Trapiá II cluster. The two clusters show very different responses to drought
Figure 16. Precipitation and reservoir volume of Capitão Mor, showing a misfit between the two datasets (red circles)
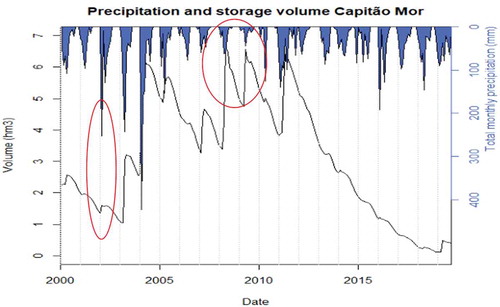
Figure 17. Perceptual model of drought propagation through a reservoir network, with the yellow circles indicating the time between the meteorological and hydrological drought and the time between the drought onset and peak. On the blue circles, the spatial distribution of stored water between upstream and downstream is shown. Downstreamness means downstreamness of volume in this figure. A scheme of the system of reservoirs and the streamflow gauging station (in blue) is also provided