Figures & data
Figure 1. Location of gauged stations along with the spatial distribution of annual mean precipitation (mm) derived from TRMM datasets. The DEM values for the basin are also indicated in the inset that shows the location of Yangtze basin in China
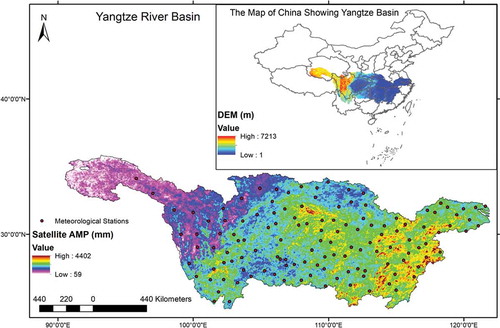
Table 1. Description of ROI models that differ in their similarity distance measure
Figure 2. Distribution selection by the L-moment ratio diagram. Three-parameter candidate distributions are represented by lines: GLO, generalized logistic; GEV, generalized extreme value; PE3, Pearson Type III; GNO, generalized normal; GPA, generalized Pareto. Two-parameter distributions are represented by points: N, normal; G, Gumbel. The average value of L-moment ratio (red circle) falls on the GEV line
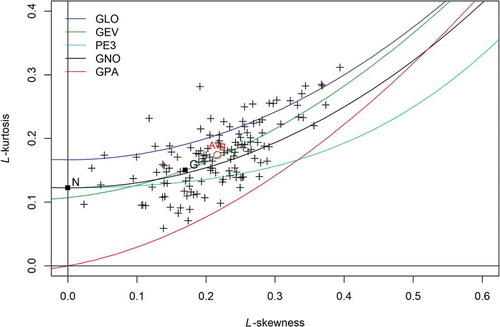
Table 2. Comparison of results in terms of mean RMSE corresponding to T = 10, 50 and 100 years for different ROI models listed in
Figure 3. Assessment of different ROI models. RMSE values in box plot format in three return periods (10, 50 and 100 years) are evaluated. Each box plot contains 128 values
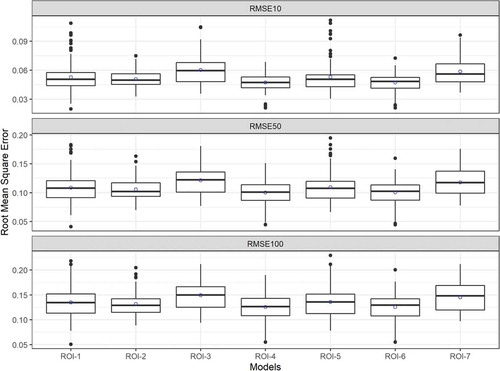
Figure 4. Regions by R-I and R-II models with current datasets. R-I was delineated by cluster analysis (Chen et al. Citation2013) while R-II was delineated based on sub-basins (Su et al. Citation2009)
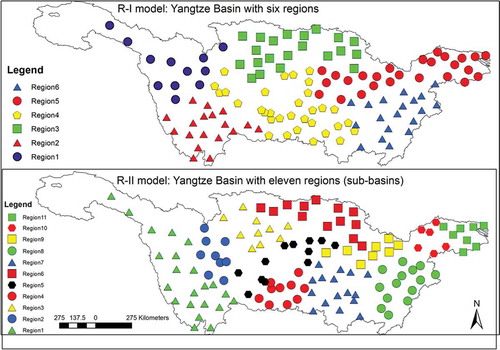
Table 3. Heterogeneity measure, H1 and PUM value in three return periods for regions delineated by the regional models with current datasets
Table 4. Summary comparison results between site-specific, ROI-4 and regional models: R-I and R-II in terms of mean PUM value
Figure 5. Model selection based on PUM value in box plot form in three return periods: 10, 50 and 100 years. R-I contains six values, R-II contains 11 values and ROI-4 contains 128 values
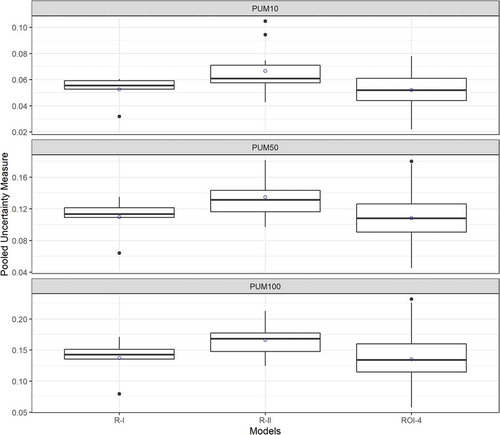
Figure 6. Shape parameter (k) value and heterogeneity measure of pooling groups delineated by ROI-4 model for each station. Group members’ shape parameter values are shown in box plot form with the pooled average indicated with blue circles
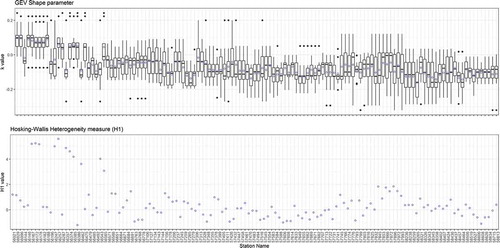
Figure 7. Spatial distribution of the heterogeneity measure (H1) for groups delineated based on the ROI-4 model at the gauged sites
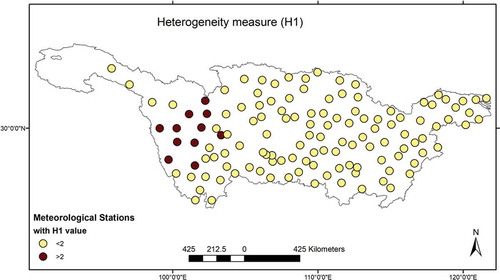
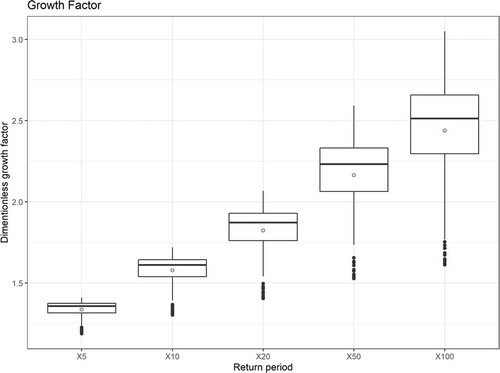
Figure 8. Box plots of growth factors with respect to return period. Each box plot contains values for all stations (pooling group formed for each station)