Figures & data
Figure 1. Plan view sketch of the fracture pattern in the discrete fracture network model. F1, F2 and F3 denote three faults with relatively greater lengths and permeabilities
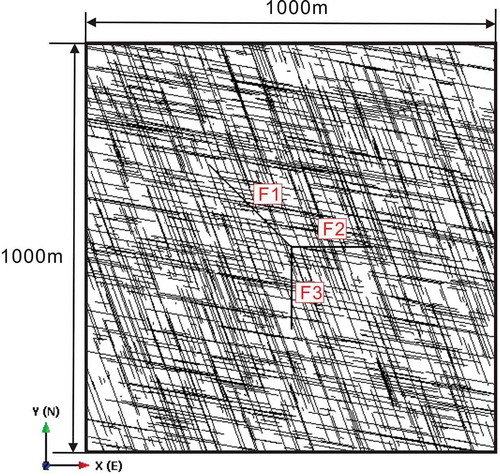
Table 1. Information about the pumping wells and the relative positions of the fault and pumping wells
Figure 2. (a) Diagram of the well layout used to carry out hydraulic tomography analysis. The blue circles represent the nine pumping locations. (b) Diagram of the well layout used for validation. The blue circles represent the wells, and the pink circles (W02 and W04) represent the two pumping locations used in the validation analysis
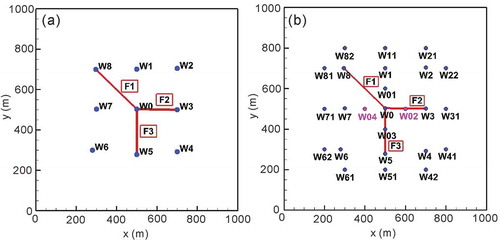
Table 2. Initial guesses for K and Ss, and correlation scales of the three cases
Figure 3. (a) Grid patterns used in Cases 1 and 2. (b) Grid pattern used in Case 3, which was refined based on the grid in Case 1. The green circles denote the pumping locations
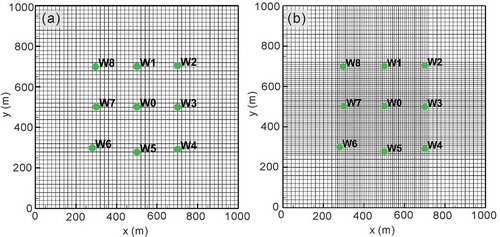
Figure 4. Head scatter plots of the calibration results in the three cases. Calibration results of (a–c) Case 1a–c, (d–f) Case 2a–c, and (g–h) Case 3a–b. The red dashed line in each graph shows a linear fit of the data, and the black line denotes the 1:1 line indicating a perfect match
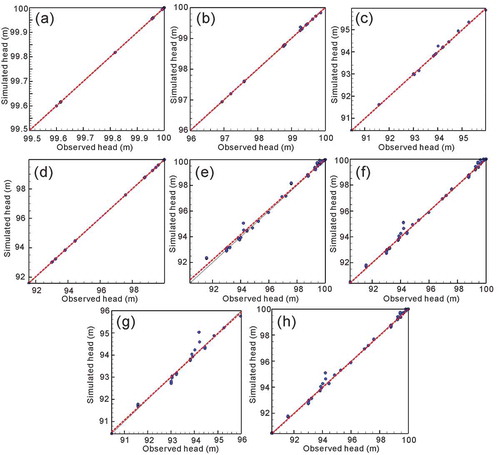
Figure 5. Contour maps of estimated K fields and validation results in Case 1 with the static data. Estimated K fields and validation results using the data at (a, d) 0.1 d, (b, e) 1 d, and (c, f) 5 d are presented. In (a–c), the black circles represent the nine pumping locations, and the black lines represent the large fractures. In (d–f), the red dashed line shows a linear fit of the data, and the black line is the 1:1 line indicating a perfect match
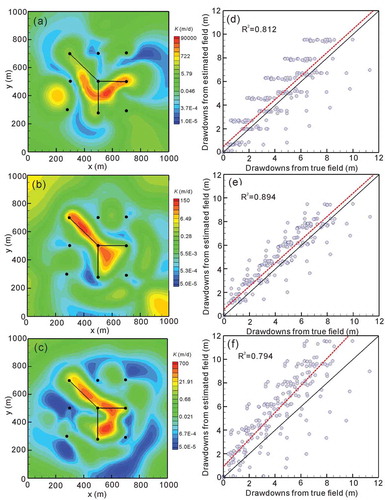
Table 3. Statistics of the validation criteria for the estimated hydraulic conductivity fields in Cases 1–3
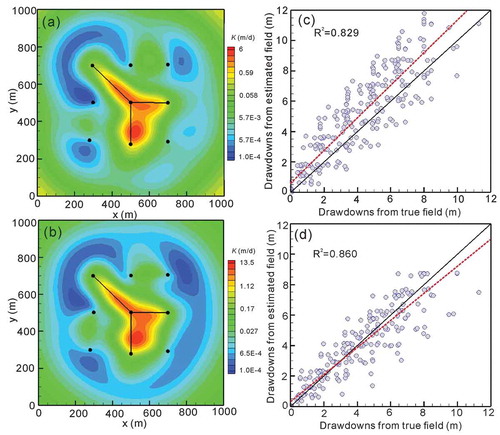
Figure 6. Contour maps of estimated K fields and validation results in Case 2 with the transient data. (a, d) Estimated K field and validation results using the data from four pumping tests at W0, W3, W5, and W8 (pink rectangles), where K and Ss were estimated simultaneously. (b, e) Estimated K field and validation results using the data from nine pumping tests without estimating Ss. (c, f) Estimated K field and validation results using the data from nine pumping tests, where K and Ss were estimated simultaneously. In (a–c), the black circles represent the nine well locations, and the black lines represent the large fractures. In (d–f), the red dashed line represents a linear fit of the data, and the black line is the 1:1 line indicating a perfect match
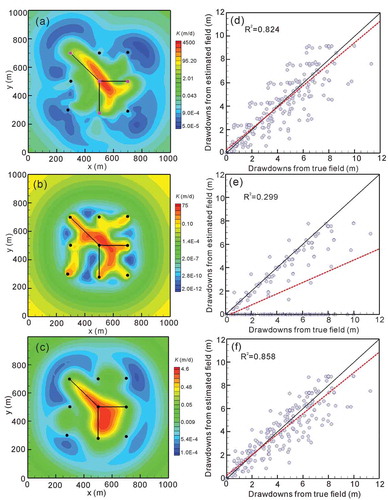
Figure 7. Contour maps of estimated K fields and validation results in Case 3 using the refined grid. (a, c) Estimated K field and validation results using the data at 5 d of nine pumping tests and (b, d) the transient data of nine pumping tests are presented. In (a, b), the black circles represent the nine pumping locations, and the black lines represent the large fractures. In (c, d), the red dashed line represents a linear fit of the data, and the black line is the 1:1 line indicating a perfect match