Figures & data
Figure 1. Index map of the Subarnarekha basin
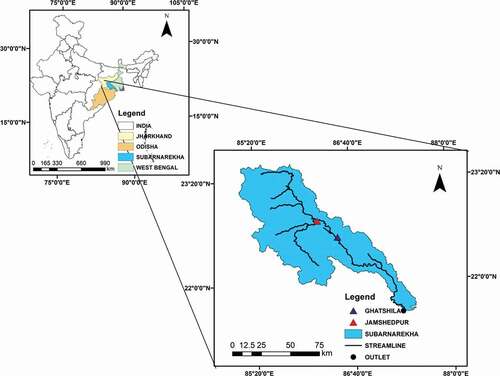
Table 1. List of explanatory variables exploring the dynamics of land-use changes in Subarnarekha basin
Figure 2. Schematization of the methodology
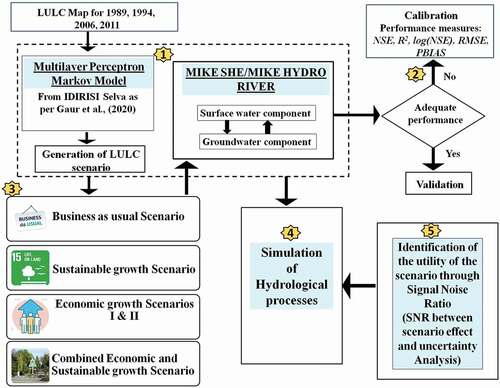
Table 2. Measures of performance evaluation used during streamflow simulation
Figure 3. (a) Time-series plot during calibration at Jamshedpur; (b) time-series plot during validation at Jamshedpur; (c) scatter plot during calibration/validation at Jamshedpur; (d) time-series plot during calibration at Ghatshila; (e) time-series plot during validation at Ghatshila; (f) scatter plot during calibration/validation at Ghatshila
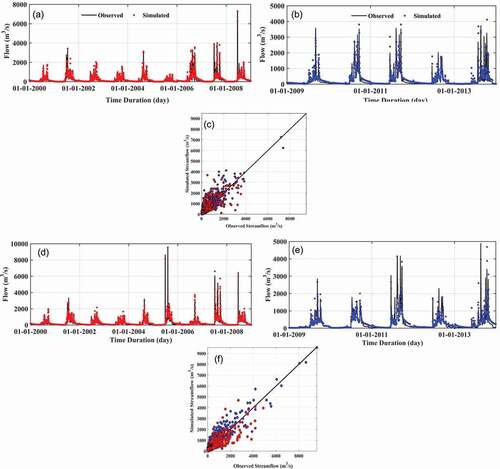
Table 3. Percent coverage of LULC classes during 1989–2011
Figure 4. Variation in evapotranspiration (ET), overland flow (OF), runoff (Runoff), and infiltration (INF) for the period 1989–2011
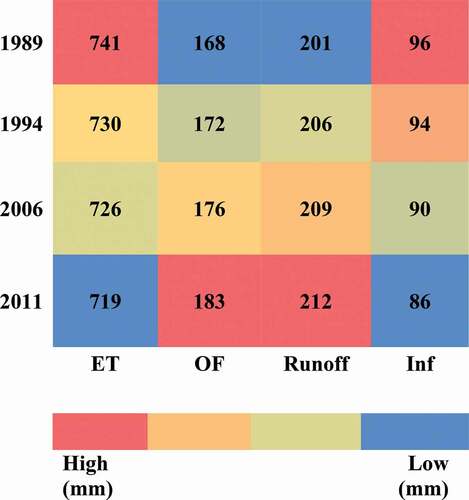
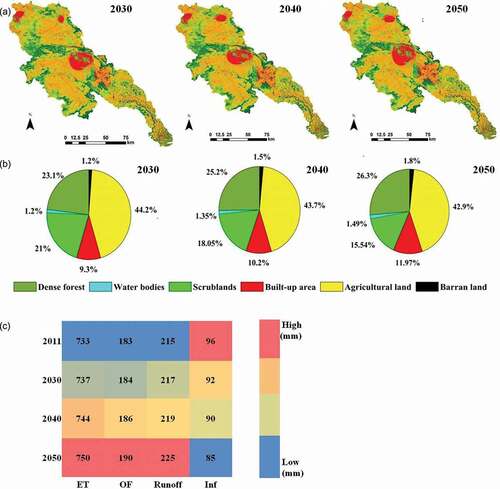
Figure 5. BAU scenario: (a) predicted LULC map for 2030, 2040, and 2050; (b) percent coverage of LULC classes for 2030, 2040, and 2050; (c) variation of evapotranspiration (ET), overland flow (OF), runoff (Runoff), and infiltration (Inf) for the period 2011–2050
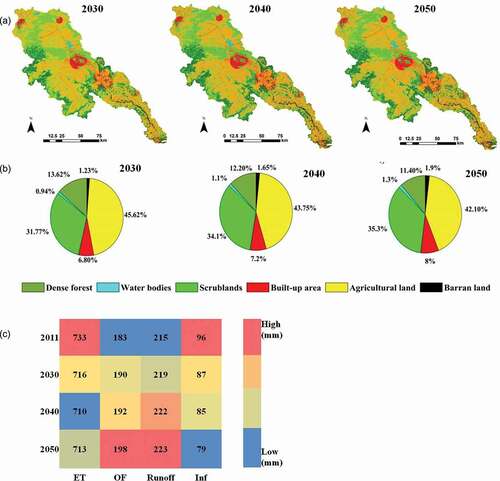
Figure 6. SG scenario: (a) predicted LULC map for 2030, 2040, and 2050; (b) percent coverage of LULC classes for 2030, 2040, and 2050; (c) variation of evapotranspiration (ET), overland flow (OF), runoff (Runoff), and infiltration (Inf) for the period 2011–2050
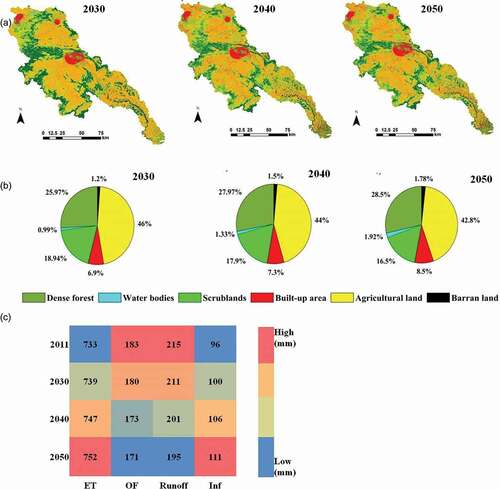
Figure 7. EG-1 scenario: (a) predicted LULC map for 2030, 2040, and 2050; (b) percent coverage of LULC classes for 2030, 2040, and 2050; (c) variation of evapotranspiration (ET), overland flow (OF), runoff (Runoff), and infiltration (Inf) for the period 2011–2050
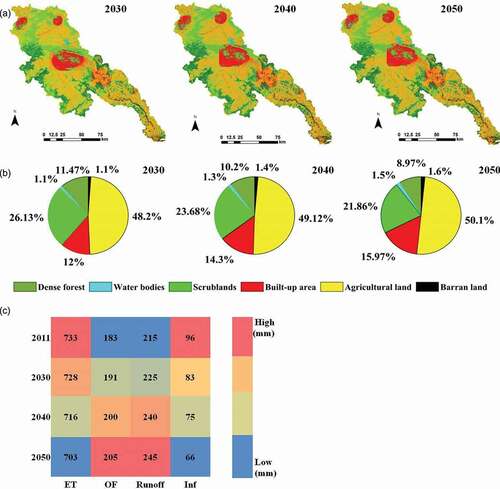
Figure 8. EG-2 scenario: (a) predicted LULC map for 2030, 2040, and 2050; (b) percent coverage of LULC classes for 2030, 2040, and 2050; (c) variation of evapotranspiration (ET), overland flow (OF), runoff (Runoff), and infiltration (Inf) for the period 2011–2050
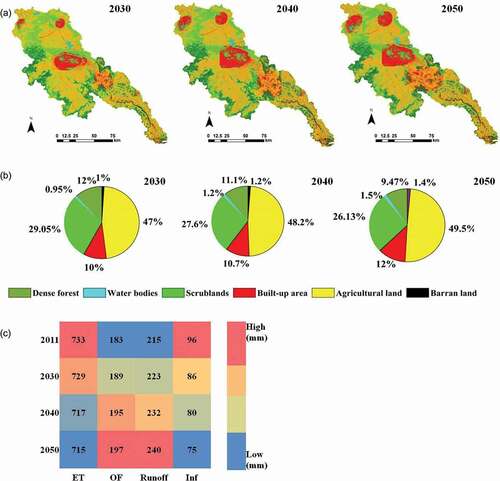
Figure 9. SG EG scenario: (a) predicted LULC map for 2030, 2040, and 2050; (b) percent coverage of LULC classes for 2030, 2040, and 2050; (c) variation of evapotranspiration (ET), overland flow (OF), runoff (Runoff), and infiltration (Inf) for the period 2011–2050