Figures & data
Figure 1. An overview of Zayandehrud basin and sub-basins upstream of Zayandehrud Dam
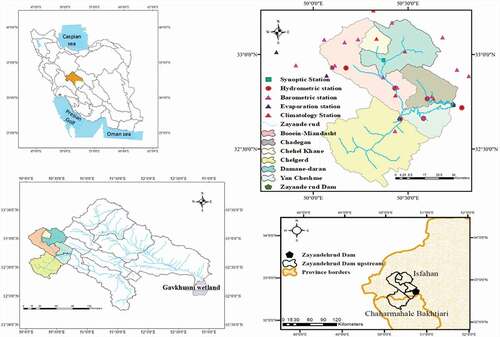
Figure 2. Comparison of area under cultivation in the upstream part of Zayandehrud basin: (a) 1982; (b) 2015. (Isfahan Regional Water Authority (IRWA) Citation2020)
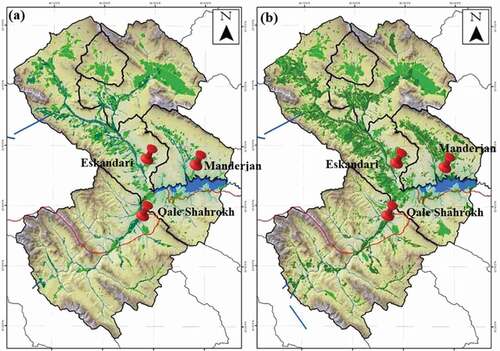
Figure 3. An overview of the research process
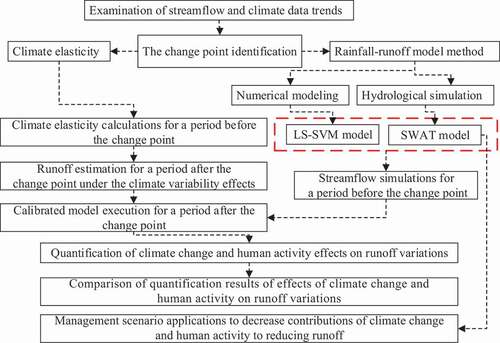
Figure 4. Runoff time series trend (1980–2016): (a) Eskandari station; (b) Ghale-Shahrokh station; (c) Manderjan station
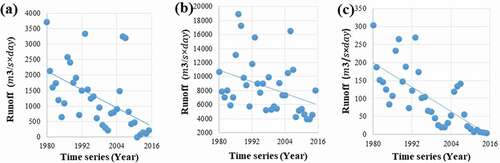
Table 1. Mann-Kendall test results of data collected from the chosen stations (1980–2016)
Figure 5. Precipitation time series trend (1980–2016): (a) Eskandari station; (b) Ghale-Shahrokh station; (c) Manderjan station
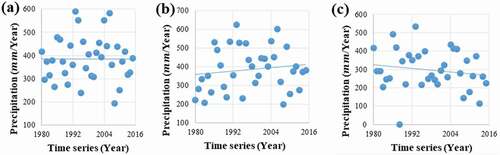
Figure 6. Evapotranspiration time series trend (1980–2016): (a) Eskandari station; (b) Ghale-Shahrokh station; (c) Manderjan station
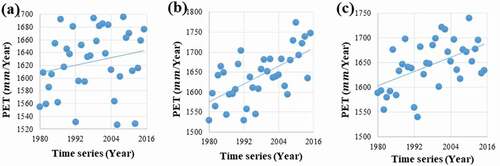
Table 2. Pettitt test results of data collected from the chosen stations (1980–2016)
Figure 7. Pettitt test results for hydrometric station runoff upstream of Zayandehrud Dam (1980–2016): (a) Eskandari station; (b) Ghale-Shahrokh station; (c) Manderjan station
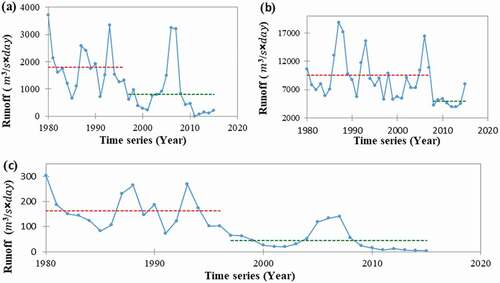
Figure 8. Pettitt test results for potential evapotranspiration (PET) at Ghale-Shahrokh station (1980–2016)
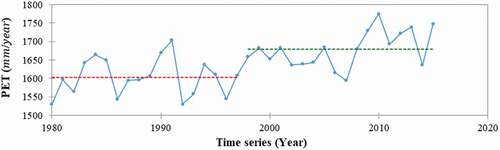
Table 3. Initial and final intervals of sensitive parameters ofthe SWAT model before and after calibration for the three hydrometric stations in Zayandehrud Dam upstream
Table 4. Calibration and validation results of the SWAT model for Zayandehrud Dam upstream stations
Figure 9. Time series of observed runoff, best runoff simulated by the SWAT model, and total monthly precipitation in the natural period with three years of warm-up (1983–1995) at three stations upstream of Zayandehrud Dam: (a) Eskandari station; (b) Ghale-Shahrokh station; (c) Manderjan station
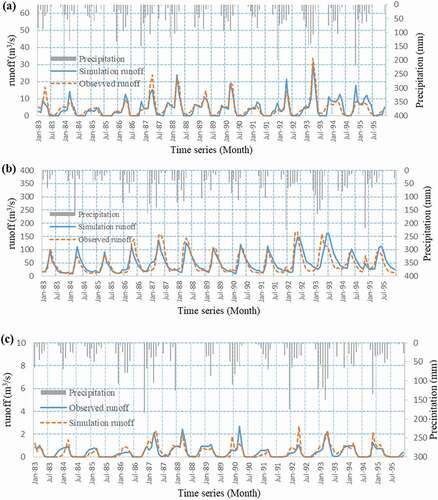
Figure 10. Time series of observed runoff, best runoff simulated by the SWAT model, and total monthly precipitation in the impact period (1997–2016) at three stations upstream of Zayandehrud Dam: (a) Eskandari station; (b) Ghale-Shahrokh station; (c) Manderjan station
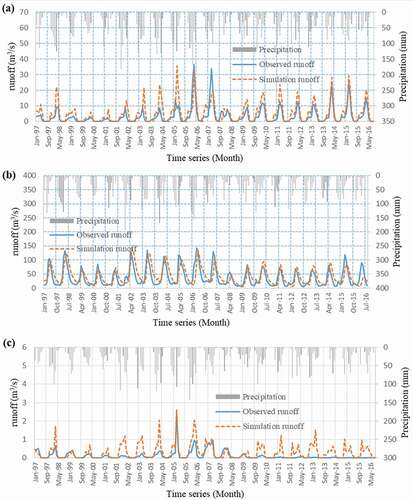
Table 5. Training and validation results of LS-SVM model for Zayandehrud Dam upstream stations
Figure 11. Time series of observed runoff, runoff simulated by LS-SVM model, and total monthly precipitation in the natural period (1980–1995) at three stations upstream of Zayandehrud Dam: (a) Eskandari station; (b) Ghale-Shahrokh station; (c) Manderjan station
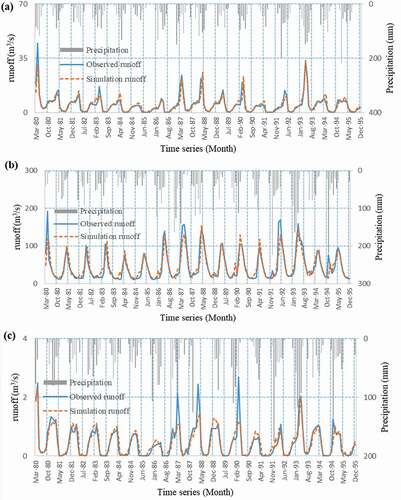
Figure 12. Time series of observed runoff, runoff simulated by LS-SVM model, and total monthly precipitation in the impact period (1997–2016) at three stations upstream of Zayandehrud Dam: (a) Eskandari station; (b) Ghale-Shahrokh station; (c) Manderjan station
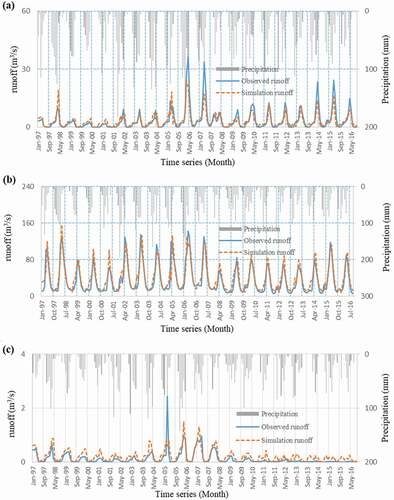
Table 6. Climate change and human activity effects on declining runoff in the studied area as determined by the climate elasticity method
Figure 13. Estimation of precipitation elasticity (εP) and potential evapotranspiration elasticity (εPET) according to relevant alteration in runoff (), precipitation (
), and potential evapotranspiration (
) at three stations upstream of Zayandehrud Dam: (a) Eskandari station; (b) Ghale-Shahrokh station; (c) Manderjan station
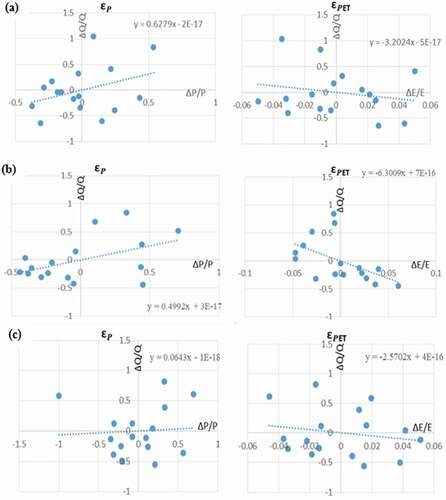
Table 7. Climate change and human activity effects on Zayandehrud Dam upstream stations runoff as determined by three different methods
Table 8. Management scenario results for mitigating climate change and human activity effects on runoff reduction
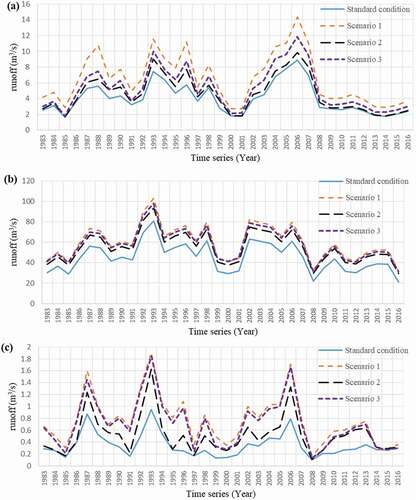
Figure 14. Runoff time series for three stations upstream of Zayandehrud Dam before and after the application of three management scenarios using the SWAT model: (a) Eskandari station; (b) Ghale-Shahrokh station; (c) Manderjan station