Figures & data
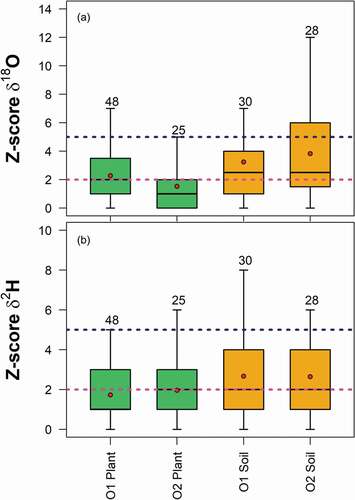
Figure 1. Sketch of the experimental set-up for each olive tree, including sap flow sensors, tension lysimeters, and holes for irrigation and soil moisture measurements
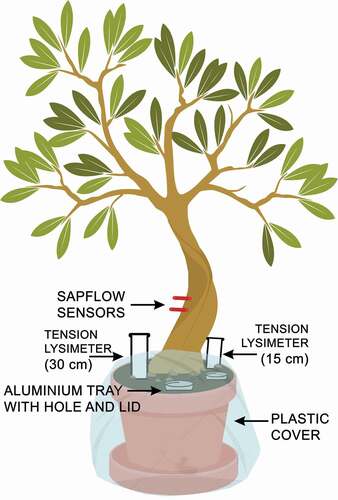
Table 1. Number of samples collected throughout the sampling rounds during the set-up, the conditioning period, and the experiment. Samples were grouped based on their type, olive tree (O1 and O2), and laboratory for soil and plant water extractions
Table 2. The isotopic compositions (mean ± standard deviation) of tap water and labelled water used for irrigation
Figure 2. Cryogenic vacuum distillation system in Lab 1 (a) and Lab 2 (b)
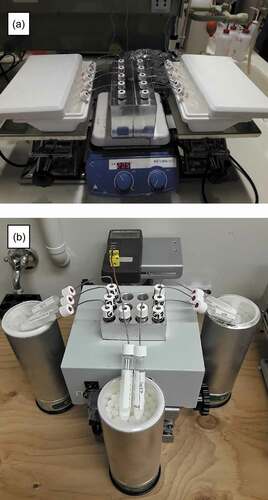
Figure 3. Time series of environmental variables measured in tree 1 (O1) and tree 2 (O2). The average soil moisture (%) is shown with error bars representing the minimum and maximum values. The vertical dashed pink line marks the start of the experiment with labelled water
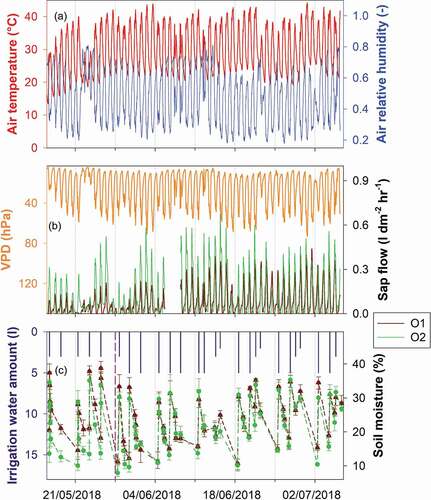
Figure 4. Time series of δ18O (panels a–d) and δ2H (panels e–h) of soil and plant water for samples extracted in the two laboratories. CVD-Soil represents the cryogenically extracted soil water, while LYS-Soil is the gravity-drained soil water obtained via tension lysimeters. The two horizontal dotted lines with their respective bands indicate the average and the standard deviation, respectively, of the isotopic composition of tap water (grey), and labelled water (pink). The vertical dashed pink line marks the start of the experiment with labelled water
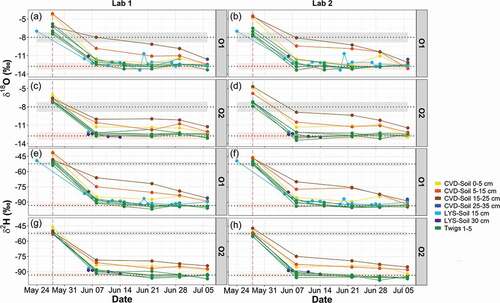
Figure 5. Time series for d-excess determined in soil and plant water for samples extracted in the two laboratories. CVD-Soil represents the cryogenically extracted soil water, while LYS-Soil is the soil water obtained via tension lysimeters. The two horizontal dotted lines with their respective bands indicate the average and the standard deviation, respectively, of the isotopic composition of tap water (grey), and labelled water (pink). The vertical dashed pink line marks the start of the experiment with labelled water
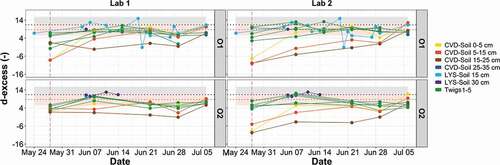
Figure 6. Dual-isotope plots of different plant tissues water (twigs, cores and roots), and soil water samples extracted by cryogenic vacuum distillation (CVD-Soil) and tension lysimeters (LYS-Soil). The global meteoric water line (GMWL) is plotted in black, round symbols indicate soil and plant water samples of O1 and triangle symbols represent soil and plant water samples of O2. Sample size is given in the Supplementary material, Table S3
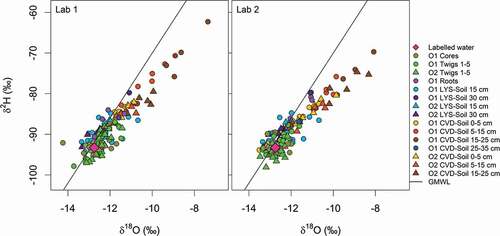
Figure 7. The spatial variation of δ18O and δ2H of plant water from various tissues, and soil water at different depths (LYS-Soil and CVD-Soil), for O1 during the tracer experiment. The vertical dotted line with grey band indicates the isotopic composition of labelled water (mean ± standard deviation)
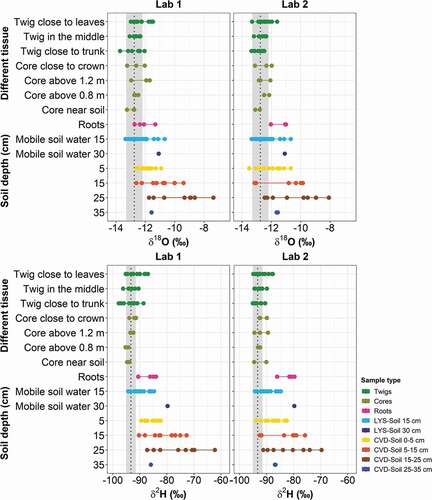
Figure 8. The spatial variation of d-excess of plant water from various tissues, and soil water at different depths (LYS-Soil and CVD-Soil), for O1 during the tracer experiment. The vertical dotted line with grey band indicates the isotopic composition of labelled water (mean ± standard deviation)
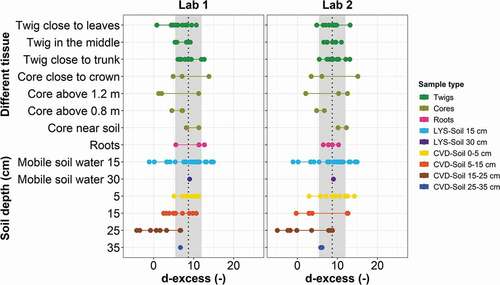
Figure 9. Box plots of (a, b) δ18O and (c, d) δ2H of O1 and O2 samples grouped by plant and soil water types for the sampling rounds irrigated with labelled water. The boxes indicate the 25th and 75th percentiles, while the whiskers represent the minimum and maximum values. The horizontal solid lines within the box mark the median and the red circles are the mean. Letters above the boxes represent the significantly different groups based on the Dunn post hoc analysis
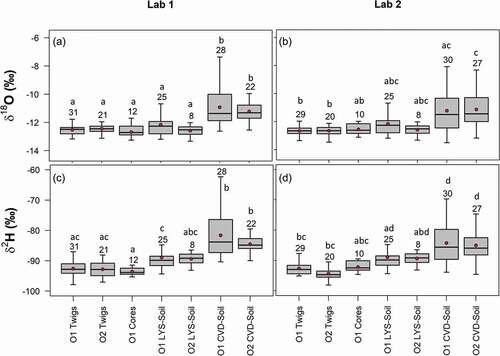
Table 3. Slopes and intercepts of the linear regressions between δ18O, δ2H and d-excess of plant tissue water and soil water of Lab 1 vs. Lab 2. Lab 1 is plotted along the x-axis while Lab 2 is plotted along the y-axis. All values are in ‰
Figure 10. Dimensionless Z-scores values for (a) δ18O and (b) δ2H grouped by cryogenically extracted soil water (CVD-Soil), and plant water (samples from twigs, cores and roots were grouped together) of O1 and O2. Sample size is reported above the boxes. The boxes indicate the 25th and 75th percentiles, while the whiskers represent the minimum and maximum values. The horizontal solid lines within the box mark the median and the red circles are the mean, respectively. The dashed purple and pink lines represent the upper limits for acceptable (Z-score = 2) and questionable (Z-score = 5) differences respectively, between Lab 1 and Lab 2 cryogenically extracted samples