Figures & data
Figure 1. Predominant climate types in Paraná State and location of weather stations. Source: Adapted from Paraná Agronomic Institute (IAPAR Citation2019); adapted from de Brazilian Institute of Geography and Statistics (IBGE Citation2010)
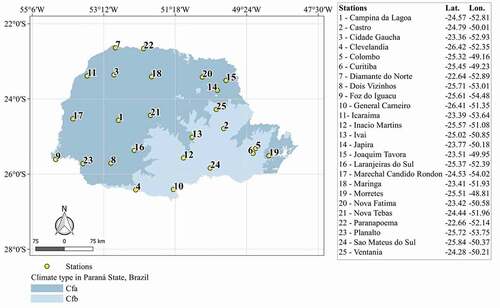
Figure 2. Seasonal average variation of the climatic variables of 15 and 10 weather stations in Cfa and Cfb climate types, respectively, in Paraná State, for the period 1 December 2016 to 8 November 2018: (a) air temperature (T; °C); (b) relative humidity (RH; %); (c) incident solar radiation (Rs; MJ m–2 h–1); (d) wind speed at 2 m height (u2; m s–1)
Table 1. Calibration of the MJS model for 25 weather stations located in Cfa and Cfb climate types, in Paraná State, for the period 1 December 2016 to 1 December 2017: linear coefficient (“a”); angular coefficient (“b”); correlation coefficient (r); and number of data in the analyses (n)
Figure 3. Spatialization of “a” and “b” coefficients of the Moretti-Jerszurki-Silva model, in Paraná State: (a) linear coefficient (“a”; mm h–1); (b) angular coefficient (“b”; mm h–1 MPa–1)
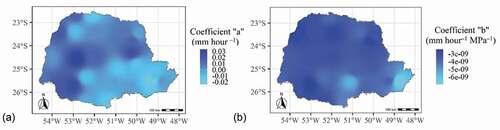
Table 2. Seasonal averagesa of EToMJS.h and EToh (mm h–1) of 25 weather stations in Paraná State, for the period 2 December 2017 to 8 November 2018
Figure 4. Averages of EToMJS.h and EToh, at the hourly scale, from weather stations according to the Cfa and Cfb climate types, in Paraná State, for the period 2 December 2017 to 8 November 2018: (a) seasonal average; (b) monthly average
Table 3. Seasonala and annual values of Nash-Sutcliffe efficiency (NSE; dimensionless), “d” index (dimensionless), root mean square error (RMSE; mm h–1) and correlation coefficient (r; dimensionless) between EToMJS.h and EToh, of 15 and 10 weather stations in Cfa and Cfb climate types, respectively, in Paraná State, for the period 2 December 2017 to 8 November 2018
Figure 5. Variation and correlation between EToMJS.h and EToh, at the hourly scale, of 15 and 10 weather stations in Cfa and Cfb climate types, respectively, in Paraná State, for the period 2 December 2017 to 8 November 2018: (a) hourly ETo without delay adjustment, in Cfa climate; (b) hourly ETo with 2-h delay adjusted, in Cfa climate; (c) hourly ETo without delay adjustment, in Cfb climate; (d) hourly ETo with 2-h delay adjusted, in Cfb climate
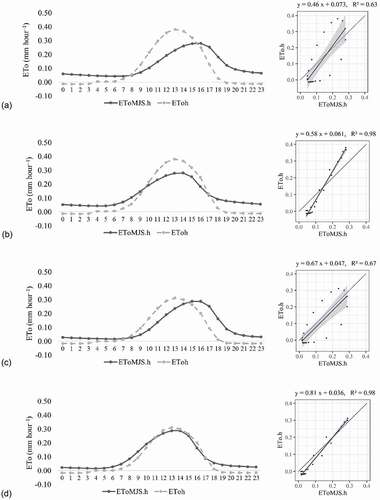
Figure 6. Indexes and errors before and after the correction of the delay observed in the correlation between EToMJS.h and EToh, at the hourly scale, of 25 weather stations, 15 and 10 in climate types Cfa and Cfb, respectively, in Paraná State, for the period 2 December 2017 to 8 November 2018: (a) Nash-Sutcliffe efficiency (NSE; dimensionless); (b) root mean square error (RMSE; mm day–1); (c) correlation (r; dimensionless)
Table 4. Average daily values of reference evapotranspiration (ETo; mm day–1) of 24 weather stations in Paraná State, for the period 2 December 2017 to 8 November 2018
Figure 7. Daily reference evapotranspiration (ETo; mm day–1) of 24 weather stations in Paraná State, obtained with the inverse distance weighting (IDW) method, for the following models: (a) ASCE-PM (ETod); (b) Moretti-Jerszurki-Silva (EToMJS.d); (c) Hargreaves and Samani (EToHS.d); (d) modified parametric (EToPET.d); and (e) Penman-Monteith temperature (EToPMT.d)
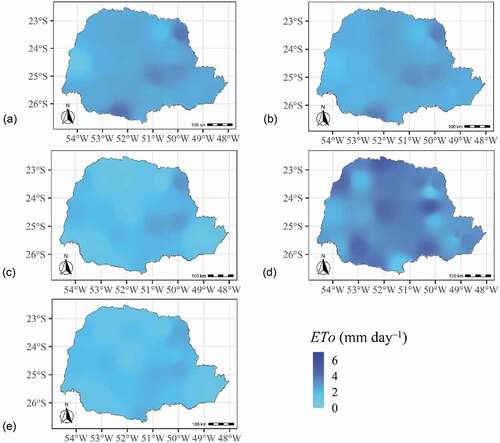
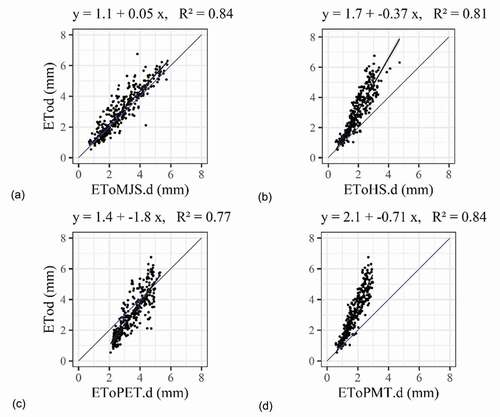
Table 5. Daily values of Nash-Sutcliffe efficiency (NSE), root mean square error (RMSE) and correlation coefficient (r; dimensionless) in the correlations between “EToMJS.d and ETod,” “EToHS.d and ETod,” “EToPET.d and ETod” and “EToPMT.d and ETod” of 15 and nine weather stations in Cfa and Cfb climate types, respectively, in Paraná State, for the period 2 December 2017 to 8 November 2018
Figure 8. Simple linear regression analysis of the values of daily reference evapotranspiration (ETo; mm day–1) of 24 weather stations in Paraná State, for the period 2 December 2017 to 8 November 2018, for the correlation between: (a) EToMJS.d and ETod; (b) EToHS.d and ETod; (c) EToPET.d and ETod; (d) EToPMT.d and ETod