Figures & data
Figure 1. Geographical distribution of the meteorological stations used in this study
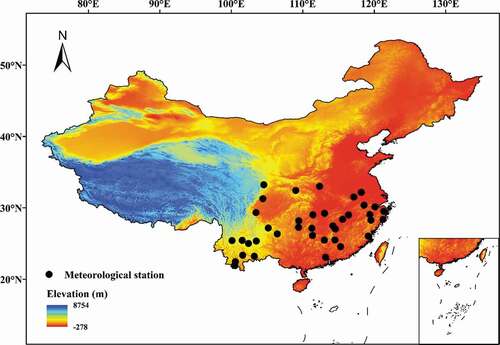
Table 1. Basic geographic and meteorological information for the 38 stations
Figure 2. E20 pan (left) and E601 pan (right)
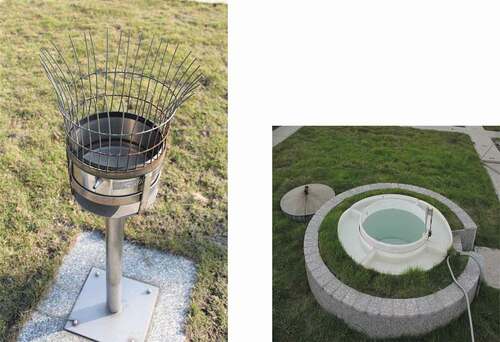
Figure 3. The structure of the extreme learning machine
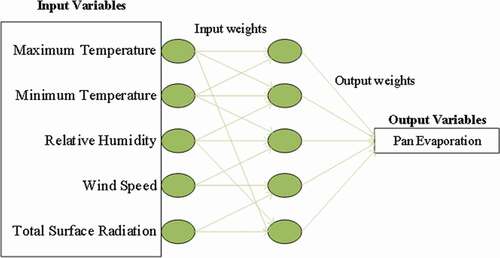
Table 2. Statistical indicators for E601 prediction using K and E20 data
Figure 4. Predicted evaporation values vs. evaporation values measured during the test period after inputting K for Wudu, Dali, Jishou and Yongzhou stations for comparison
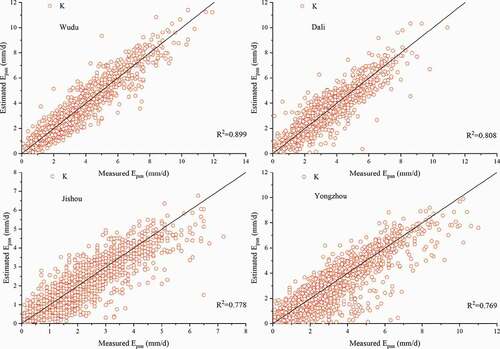
Figure 5. Predicted evaporation values vs. evaporation values measured during the test period after inputting K for Nanchang, Boyang, Bijie and Lishui stations for comparison
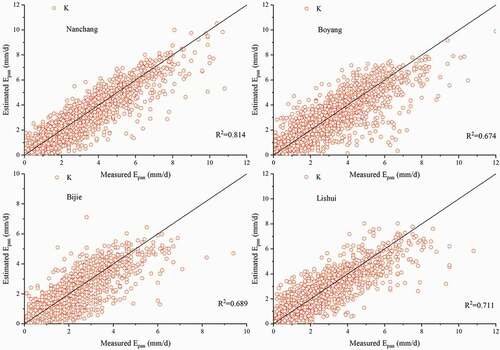
Table 3. Performance of the ELM model in predicting E20 evaporation using meteorological data and E601 data using different combinations of parameters (bold shows the best performing combination)
Table 4. The average values of statistical indicators for predictions of E20 evaporation for 38 stations using different combinations of parameters (bold shows the best performing combination)
Figure 6. Predicted and measured evaporation values for Jishou, Yueyang, Ankang and Nanyang sites using different combinations of input parameters during testing
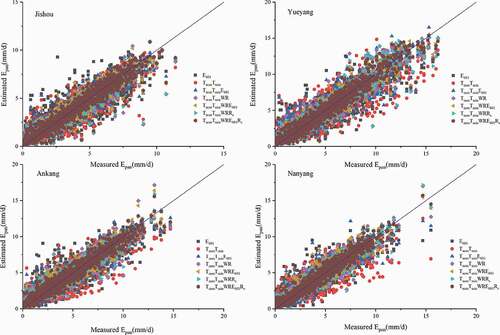
Figure 7. MAE values for comparison between testing and training for 10 sites (E20 prediction)
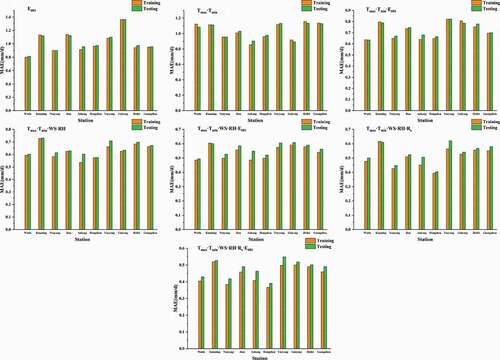
Table 5. Performance of the ELM in predicting E601 evaporation using meteorological data and E20 data using different combinations of parameters (bold shows the best performing combination)
Table 6. The average values of statistical indicators for prediction of E601 evaporation for 38 stations using different combinations of parameters (bold shows the best performing combination)
Figure 8. Model performance for Jinghong, Ningguo and Jinhua sites in predicting E601 using Tmax·Tmin and Tmax·Tmin·E20 for comparison
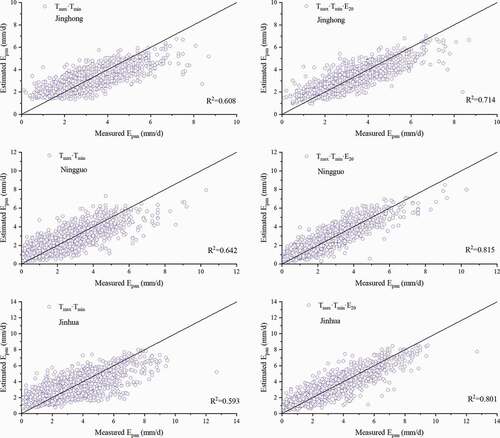
Figure 9. Model performance for Jinghong, Ningguo and Jinhua sites in predicting E601 using Tmax·Tmin·WS·RH and Tmax·Tmin·WS·RH·E20 for comparison
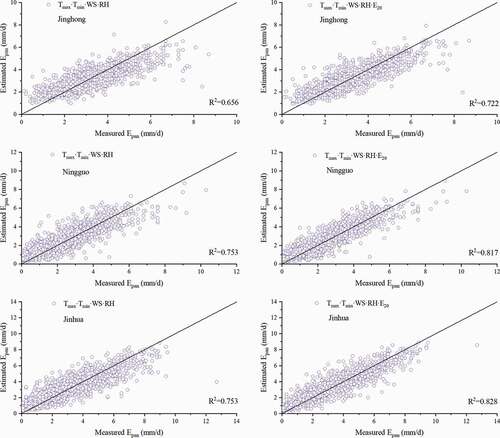
Figure 10. Model performance for Jinghong, Ningguo and Jinhua sites in predicting E601 using Tmax·Tmin·WS·RH·Rs and Tmax·Tmin·WS·RH·Rs·E20 for comparison
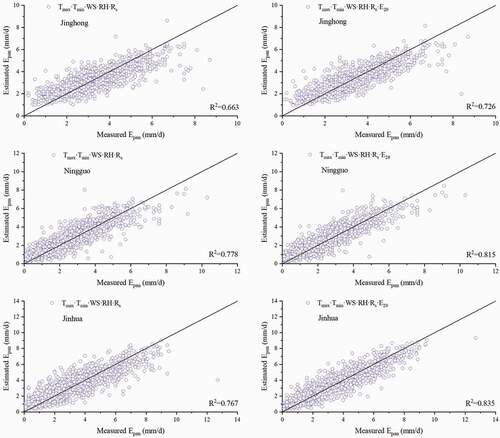
Figure 11. Predicted and measured evaporation values for Chenzhou, Yongzhou, Jian and Mengzi sites using different combinations of input parameters during testing
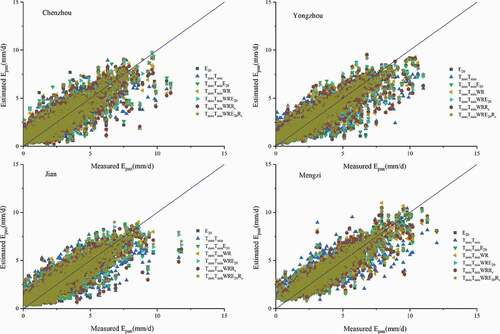
Figure 12. Predicted and measured evaporation values for Yuanmou, Zhanyi, Changde and Yichun sites using different combinations of input parameters during testing
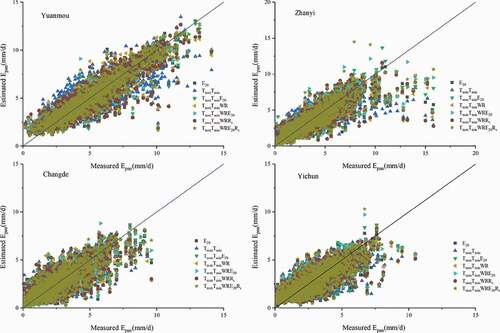
Figure 13. MAE values for comparison between testing and training for 10 sites (E601 prediction)
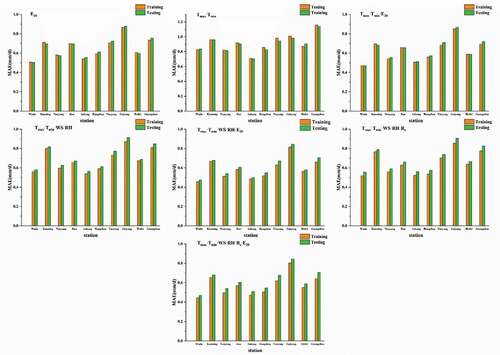
Table 7. R2 for conversion between E20 data and E601 data using combinations of three parameters (bold indicates better prediction)
Figure 14. Spatial performance of the model using the input parameter combination Tmax·Tmin·WS·RH·Rs·E601.
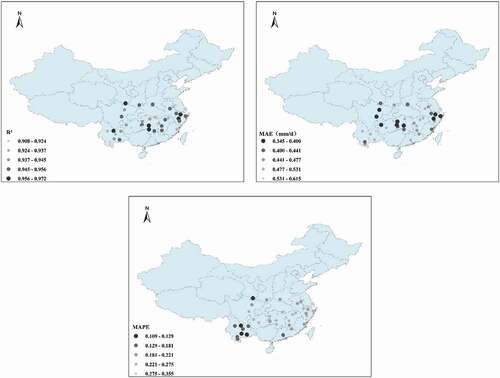
Figure 15. Spatial performance of the model using the input parameter combination Tmax·Tmin·WS·RH·E601.
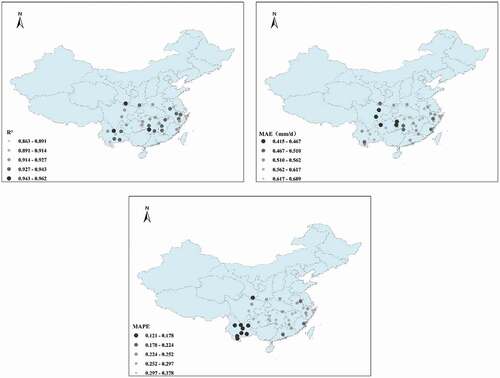
Figure 16. Spatial performance of the model using the input parameter combination Tmax·Tmin·WS·RH·Rs.
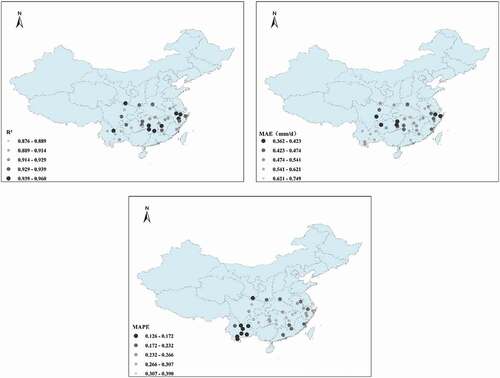
Figure 17. Spatial performance of the model using the input parameter combination Tmax·Tmin·WS·RH
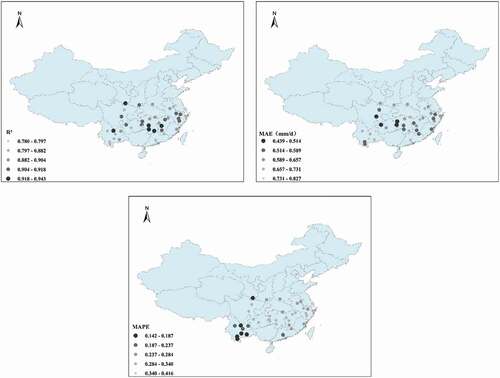
Figure 18. Spatial performance of the model using the input parameter combination Tmax·Tmin·E601
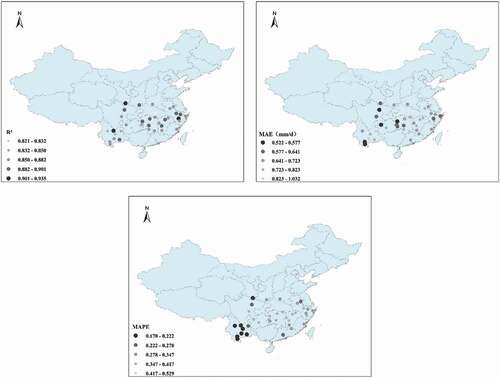
Figure 19. Spatial performance of the model using the input parameter combination Tmax·Tmin
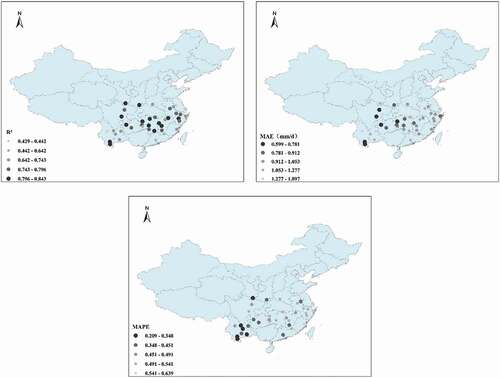
Figure 20. Spatial performance of the model using the input parameter E601
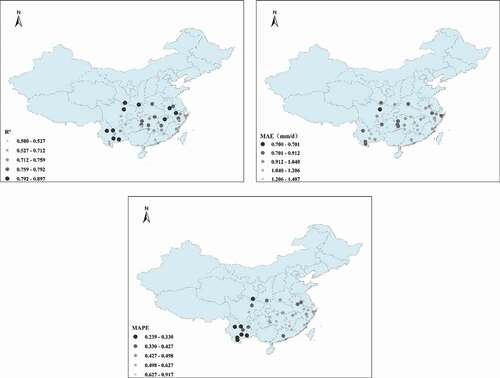
Figure A1. Use of the ELM model with different combinations of input parameters for 38 sites to calculate the statistical indexes for E20 (training)
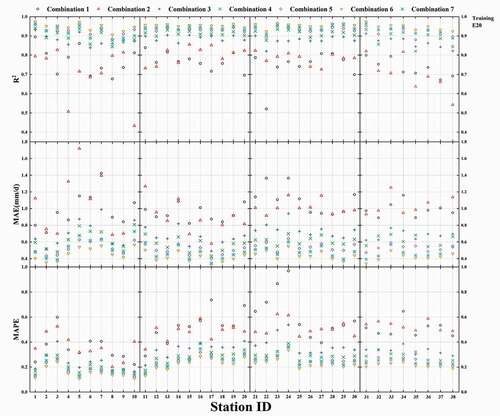
Figure A2. Use of the ELM model with different combinations of input parameters for 38 sites to calculate the statistical indexes for E20 (testing)
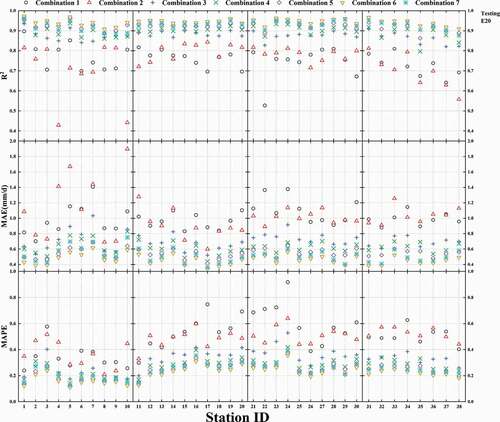
Figure A3. Use of the ELM model with different combinations of input parameters for 38 sites to calculate the statistical indexes for E601 (training)
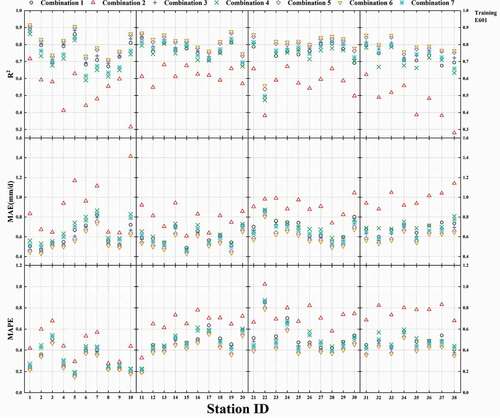
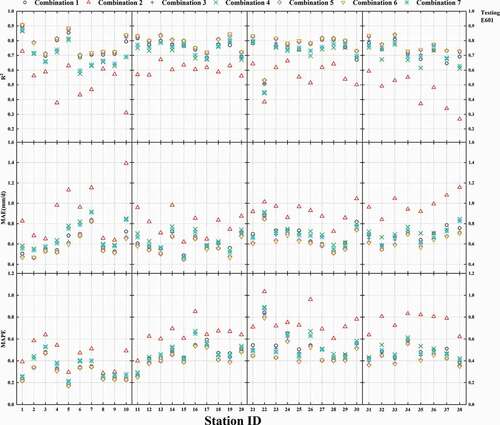
Figure A4. Use of the ELM model with different combinations of input parameters for 38 sites to calculate the statistical indexes for E601 (testing)