
Figures & data
Figure 1. The selected catchments in Sweden and their properties: (a) locations of the catchments and distributions of their key topographic properties (area, slope, elevation and latitude); (b) climate of the selected catchments, and the distributions of mean annual precipitation, percentage of precipitation in the form of snowfall, mean annual temperature and the aridity index (ratio of mean precipitation to mean potential evapotranspiration); (c) degree of regulation (DOR, percentage of mean annual runoff from the drainage area of the reservoir) in the catchments and distributions of shares of prevailing land-use types, and water surfaces and glaciers; and (d) mean annual runoff in the catchments and distributions of the centre of timing (COT, in days of water year; Kromos et al. Citation2016), runoff coefficients, and annual maxima and seven-day minima. The hydroclimatic variables presented in the figure were obtained over water years 1962–2020.
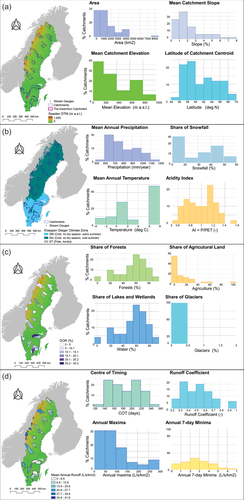
Figure 2. Illustration of relationships between performance indicator values and the absolute values of the Wilcoxon rank sum (WRS) test statistic. Larger values of performance indicators imply higher model efficiency, while larger absolute values of the test statistics imply rejection of the WRS test null hypothesis, i.e. the signatures obtained from the observed and simulated flows have statistically different medians. Panel (a) illustrates a performance indicator that can be considered informative about model ability to simulate the distribution of a signature, while panel (b) illustrates a non-informative indicator.
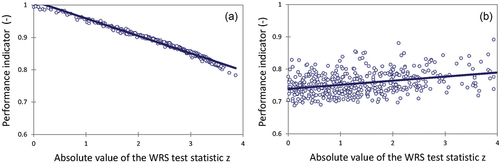
Figure 3. Model performance across the 50 catchments in the calibration (left), evaluation (mid) and full record periods (right panels). Model performance is quantified in terms of the objective function (OF, EquationEquation 1(1)
(1) ; panels a–c), and Kling-Gupta efficiency coefficients obtained from daily flows (KGE; panels d–f) and log-transformed flows (KGE[1/√Q]; panels g–i).
![Figure 3. Model performance across the 50 catchments in the calibration (left), evaluation (mid) and full record periods (right panels). Model performance is quantified in terms of the objective function (OF, EquationEquation 1(1) OF=0.8KGE+0.2KGE1/Q(1) ; panels a–c), and Kling-Gupta efficiency coefficients obtained from daily flows (KGE; panels d–f) and log-transformed flows (KGE[1/√Q]; panels g–i).](/cms/asset/6f19cf1c-cd38-4b06-af73-b9fb0970d047/thsj_a_2104646_f0003_c.jpg)
Figure 4. Model performance in the 50 catchments in the calibration, evaluation and full record periods, and performance of the 50 best parameter sets in the Assembro catchment in the calibration period. Boxes indicate 25th, 50th and 75th percentiles, while the whiskers stretch to the point nearest to 1.5 times the interquartile range from the boxes. Outliers and negative values are omitted from the figures for clarity. Abbreviations for the performance indicators are explained in .
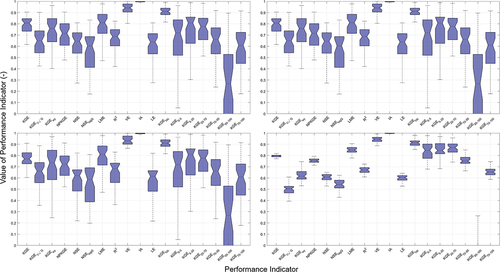
Table 1. Hydrological signatures (flow statistics, and runoff timings and durations) used for model evaluation.
Table 2. Performance indicators used for model evaluation.
Figure 5. Model performance in reproducing distributions of the selected hydrological signatures (). Cell values are percentages of successful simulations, i.e. percentage of catchments in the calibration (CAL), evaluation (EVAL) or full record period (FRP), or percentage of the behavioural parameter sets in the Assembro catchment in the calibration period (GLUE) that well reproduced the distributions of the signatures. The last column in the heat map shows the average performance of the simulation across all signatures.
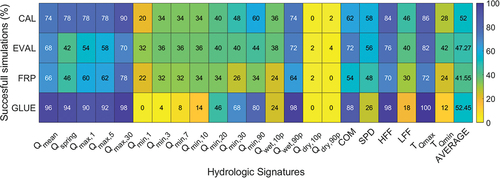
Figure 6. Percentage of catchments in which significant trends were detected in the selected hydrological signatures () according to the results of the Mann-Kendall test in the calibration (CAL), evaluation (EVAL) and full record periods (FRP). The signatures were computed from observed flows.
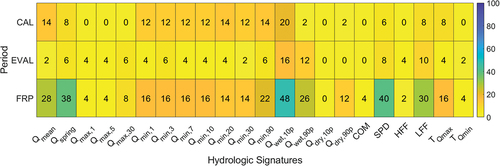
Figure 7. Model performance in reproducing trends in the selected hydrological signatures (). Cell values in the heat map are percentages of successful simulations, i.e. percentage of catchments in the calibration (CAL), evaluation (EVAL) or full record period (FRP), or percentage of the behavioural parameter sets in the Assembro catchment in the calibration period (GLUE) that successfully reproduced trends (or the lack of trends) in hydrological signatures. The last column in the heat map shows average performance across all signatures.
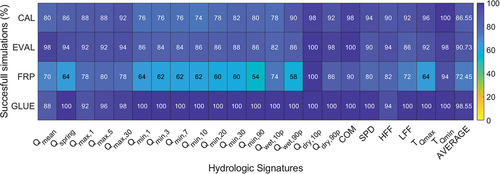
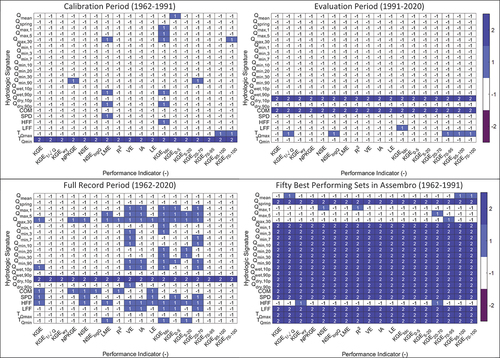
Figure 8. Informativeness of performance indicators () about model ability to reproduce distributions of the hydrological signatures () in different simulations. Values of 1 in the heat maps indicate that the two groups of simulations (i.e. simulations in which the distributions were well reproduced versus the remaining ones) have significantly different indicator values, suggesting that a specific indicator can be informative about model performance in reproducing the distributions. Values of −1 mean that the two groups of simulations result in similar values of an indicator, suggesting that the indicator is not informative about model ability to reproduce the distributions. A value of 2 (−2) suggests that the distributions of a signature were reproduced in all (none) of the catchments or by the behavioural parameter sets (GLUE), respectively.
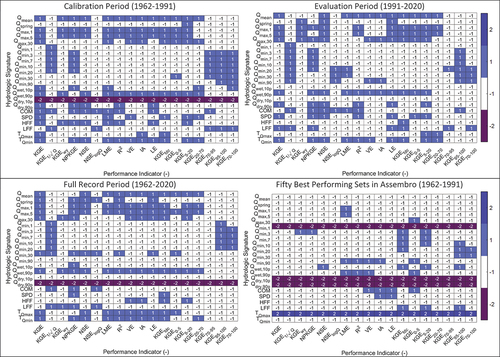
Figure 9. Pearson correlation coefficients between the values of performance indicators () and absolute values of the Wilcoxon rank sum test statistic, z, obtained in different simulations. Strong negative correlations suggest that a specific indicator can be informative about the model ability to reproduce the distribution of a hydrological signature (), as opposed to weak negative or positive correlations.
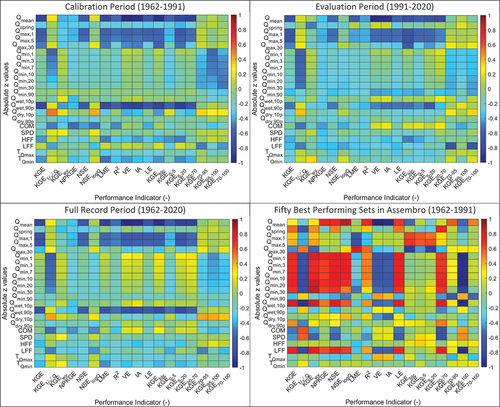
Figure 10. Informativeness of performance indicators () about model ability to reproduce trends in series of hydrological signatures () in different simulations. Values of 1 in the heat maps indicate that the two groups of simulations (i.e. simulations in which the trends were well reproduced versus the remaining ones) have different indicator values, which can suggest that a specific indicator is not informative about model performance in reproducing the trends. Values of −1 mean that the two groups of simulations results in similar values of a specific indicator, suggesting that a specific PI is not informative about model ability to reproduce the trends. A value of 2 (−2) suggests that the trends of a signature were reproduced in all (none) of the simulations or by the behavioural parameter sets (GLUE), respectively.
Supplemental Material
Download MS Word (1.8 MB)Supplemental Material
Download MS Word (1.8 MB)Data availability statement
Hydro-climatic data can be retrieved from the Swedish Meteorological and Hydrological Institute (SMHI) database (http://vattenwebb.smhi.se/). Geospatial data for the streamflow stations can be downloaded from the SMHI SVAR database (https://www.smhi.se/publikationer/svar-svenskt-vattenarkiv-1.17833).