
Figures & data
Figure 1. The Mahanadi River basin boundary and the analysed gauges and their catchments. Abbreviations for gauge names are Ba, Basantpur; Ka, Kantamal; Ke, Kesinga; Su, Sundergarh; and Sa, Salebhata.
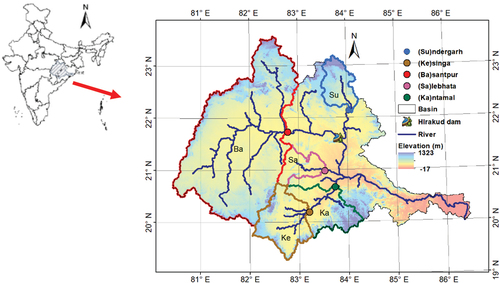
Table 1. Summary of model input datasets used in this study.
Figure 2. (a) National soil map derived from the National Bureau of Soil Survey and Land Use Planning (NBBSSLUP) with a spatial resolution of 500 m; and (b) global soil map derived from SoilGrids with a spatial resolution of 250 m for the Mahanadi River basin. The spatial resolution of the maps shown here is 5 km, which is used by the VIC model to perform the simulations.
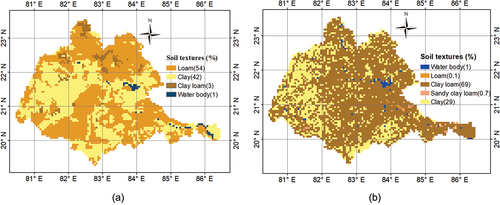
Figure 3. (a) National LULC map derived from National Remote Sensing centre (NRSC), India, for 2013–2014, with a resolution of 56 m; and (b) global LULC map derived from ESA CCI for 2014, with a resolution of 250 m.
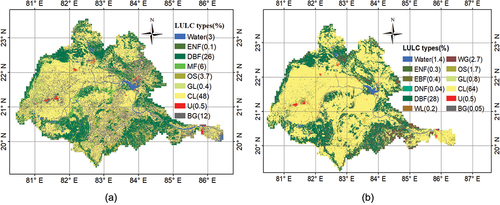
Figure 4. (a) Cumulative daily precipitation of sub-basin Basantpur from IMD, GPM IMERG and ERA5-Land, for the period 2014–2016. (b) Daily minimum and maximum temperatures for sub-basin Basantpur from IMD and ERA5-Land, for the period 2014–2016.
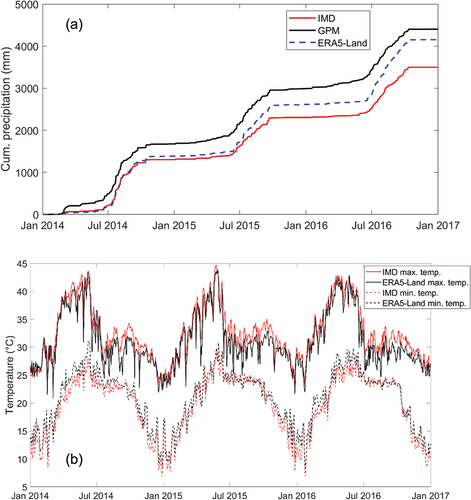
Table 2. Description of the experiments performed in this study.
Figure 5. (top) Values of KGE calculated for prediction of discharge of all experiments at all sub-basins. The box plots of KGE values represent 250 behavioural models, meaning the uncertainties stemming from 250 model parameters sets. (bottom) Bar charts representing the percent changes in datasets (precipitation, temperature, soil and land cover) obtained from global sources with respect to those of datasets from local source. In the legend, T, P, S and L are temperature, precipitation, soil and LULC, respectively.
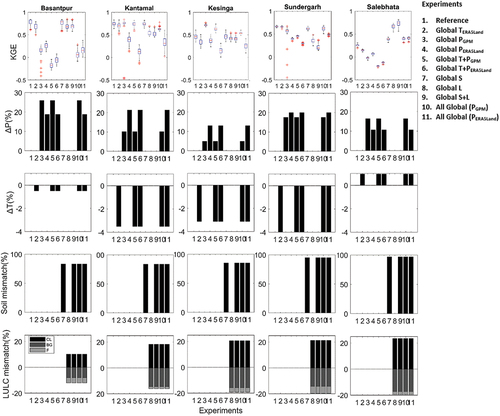
Figure 6. Annual average of runoff and evapotranspiration at Basantpur for all experiments. In the legend, T, P, S and L are temperature, precipitation, soil and LULC, respectively. Note that the precipitation varies across experiments.
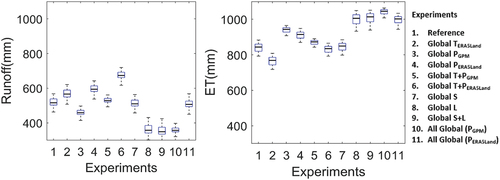
Figure 7. Comparison of daily observed discharge and ensemble mean of simulated discharge of experiments at Basantpur using (a) precipitation from GPM, ERA5-land and IMD (reference); (b) temperature from ERA5-Land and IMD (reference); (c) soil from SoilGrids and local soil (reference); (d) LULC from ESA CCI and local LULC (reference); (e) all global datasets and all local datasets (reference), averaged for the years 2014–2016. In order to show the details of the hydrographs, they are zoomed in to the monsoon (wet) months; results for other sub-catchments are similar and can be found in the Supplementary material (Figs. S4–S7).
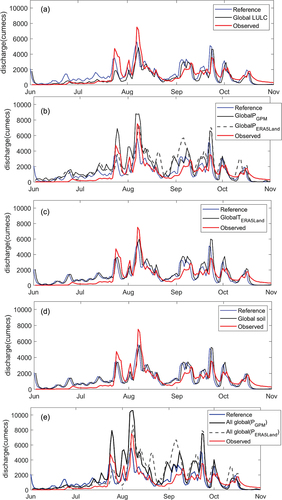
Figure A1. Spatial distributions of mean annual rainfall over Mahanadi River basin averaged for the time period 2014–2016, derived from IMD gauge-based, IMERG, and ERA5-LAND precipitation datasets.
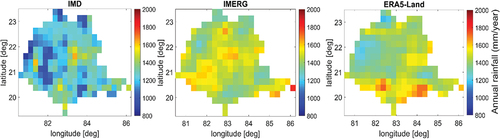
Figure A2. Spatial distributions of (a) correlation between GPM and IMD; (b) correlation between ERA5-Land and IMD; (c) PBIAS of GPM against IMD; and (d) PBIAS of ERA5-Land and IMD daily rainfall over Mahanadi River for 2014–2016.
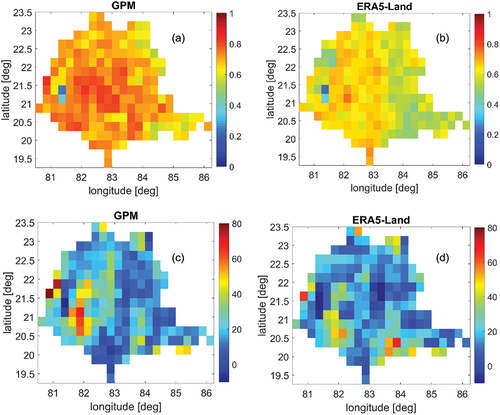
Figure A3. Spatial distributions of mean daily maximum temperature derived from (a) IMD and (b) ERA5-LAND; and spatial distributions of mean daily minimum temperature derived from (c) IMD and (d) ERA5-Land, averaged for the period 2014–2016.
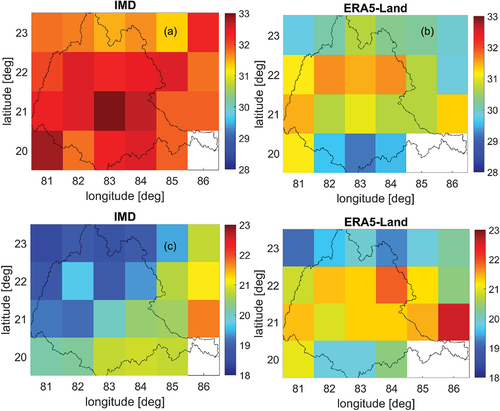
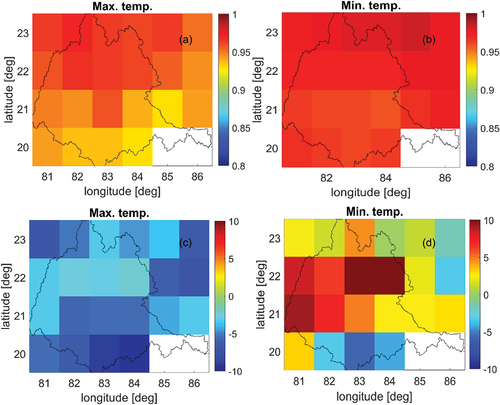
Figure A4. Spatial distributions of (a) correlation between maximum temperature from ERA5-Land and IMD; (b) correlation between minimum temperature from ERA5-Land and IMD; (c) PBIAS between maximum temperature from ERA5-Land and IMD; and (d) PBIAS between maximum temperature from ERA5-Land and IMD, over Mahanadi River averaged for 2014–2016.
Supplemental Material
Download MS Word (3.8 MB)Data availability statement
The DEM is freely available from https://bhuvan-app3.nrsc.gov.in/data/download/index.php. The unit hydrograph is adapted from https://vic.readthedocs.io/en/vic.4.2.d/Documentation/Routing/UH/. Daily gridded rainfall and maximum and minimum temperature are freely available from http://www.imdpune.gov.in/Clim_Pred_LRF_New/Grided_Data_Download.html. Wind speed data is freely available from https://psl.noaa.gov/cgibin/db_search/DBSearch.pl?Dataset=NCEP±Reanalysis±Daily±Averages. Observed discharge data are available from http://cwc.gov.in/. The source code for VIC-3L version 4.2.d is available from https://github.com/UW-Hydro/VIC/releases/tag/VIC.4.2.d. Soil textural information to prepare the soil map of soilGrids is derived from https://soilgrids.org/. The ESA CCI land cover map was downloaded from www.esa-landcover-cci.org/. The ERA5-Land precipitation and temperature products were obtained from https://cds.climate.copernicus.eu/cdsapp#!/dataset/reanalysis-era5-land?tab=form.