Figures & data
Table 1. Earth observation (EO) products, and World-wide HYPE (WWH) results.
Figure 1. Comparison of the long-term annual means for the analysed period (2000–2014) of the six analysed variables (rows): potential evapotranspiration (PET), actual evapotranspiration (AET), fractional snow cover (FSC), snow water equivalent (SWE), soil moisture (SM), and changes in water storage (ΔS) for values simulated by World-wide HYPE (WWH; column 1), values from the selected Earth observation (EO) products (column 2) and relative difference (column 3). The relative difference uses the EO product as the baseline.
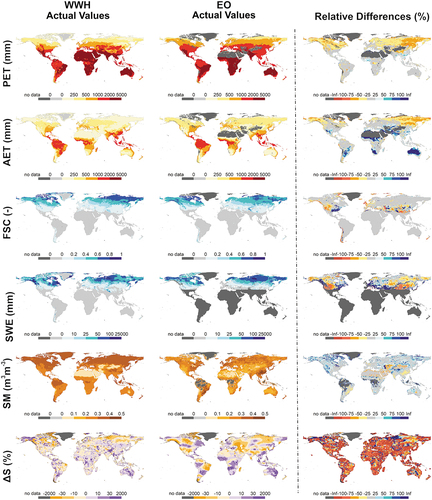
Figure 2. Agreement in monthly dynamics for the study period, 2000–2014, in terms of Kling-Gupta efficiency (KGE) and each of its components: Pearson correlation coefficient (CC), relative error (RE) and relative error of standard deviation (RESD) (columns) for each of the six selected hydrologic variables (rows): potential evapotranspiration (PET), actual evapotranspiration (AET), fractional snow cover (FSC), snow water equivalent (SWE), soil moisture (SM), and changes in water storage (ΔS). High agreement is represented in blue, while low agreement is represented in red (column 1 and 2) yellow and green (column 3 and 4).
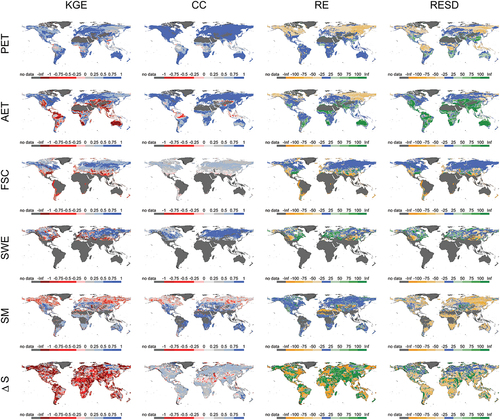
Figure 3. Monthly long-term mean of changes in water storages (ΔS) obtained from World-wide HYPE (WWH) (columns 1 and 3) and Earth observation (EO) products from Gravity Recovery and Climate Experiment (GRACE) (columns 2 and 4) for the period 2000–2014.
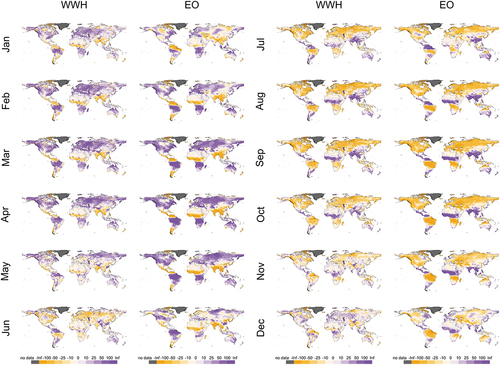
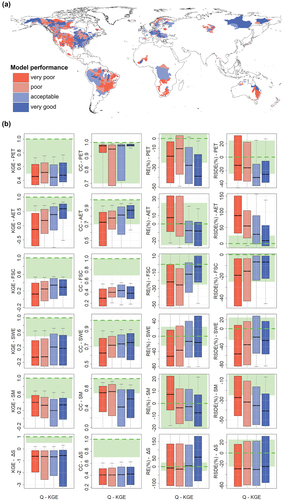
Figure 4. (a) Map of World-wide HYPE (WWH) model performance in terms of river discharges assessed in 4367 catchments with available river discharge observations. These catchments are divided into four groups using the quantiles of the Kling-Gupta efficiency (KGE) distribution for WWH model performance. (b) Agreement of WWH and Earth observation (EO) products in terms of internal hydrologic variables for the period 2000–2014: potential evapotranspiration (PET), actual evapotranspiration (AET), fractional snow cover (FSC), snow water equivalent (SWE), soil moisture (SM), and changes in water storage (ΔS) (y-axis) for each category of WWH flow performance with respect to in situ observations (x-axis). Each column represents a different metric: KGE, Pearson correlation coefficient (CC), relative error (RE) and relative error of standard deviation (RESD). Optimum values are represented by the dashed green line and good performance interval by green area. Note: the 4367 river discharge observation stations were not used in the WWH calibration process.