
Figures & data
Figure 1. Stacked area graph with number of raingauges installed over the Basilicata Region (Southern Italy) between 1916 and 2020. Initially, a national agency was in charge of the installation and maintenance of the monitoring network (SIMN – Servizio Idrografico e Mareografico Nazionale), while several additional networks have been introduced in more recent years addressing different purposes and managed by different agencies.
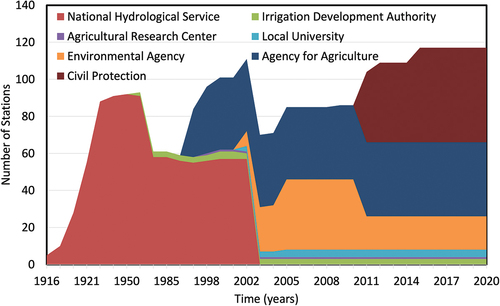
Figure 2. Three examples of cross-sections: (a) Alcantara River (Italy) during a recent drought observed in the summer of 2021; (b) Sarno River (Italy) with macroplastics and organic matter transport; (c) flood with wood transport in the Ezine River, northern Turkey.
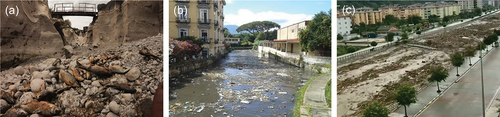
Table 1. Initiatives orientated towards promoting the use of new technologies in hydrological monitoring.
Figure 3. Example of satellite-based classification for the Po River (approximately from Morano at Po and Castelnuovo di Scrivia, NW Italy) and the Sesia River over the period January–July 2016–2021 using Copernicus Sentinel-2 data. The map in the bottom left corner displays the location of both rivers using a star symbol. Water units are represented by shades of blue, vegetation (both riverbed and riparian) by shades of green, and sediments by shades of brown. Boxes A and B specifically focus on the impact of drought on the Po River’s water presence. The map on the left of each box shows the frequency of “water” units from January to July across the years 2016–2021, while the map on the right depicts the same for January to July 2022. This comparison allows for easy visualization of changes in water distribution over time.
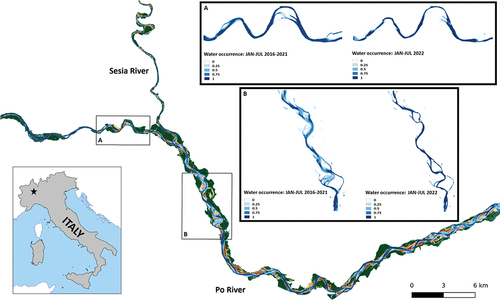
Figure 4. Turbidity and water level diagram from February to June 2022 with associated photographs taken at different levels of turbidity (Meisdorf station on the Selke River – tributary of the Bode River, Germany).
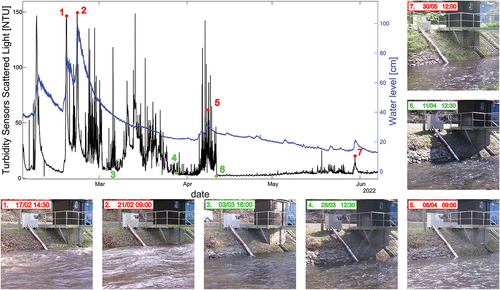
Figure 5. Turbidity diagram measured in February 2023 with associated photographs taken in different conditions from the trap-camera and UAS hovering.
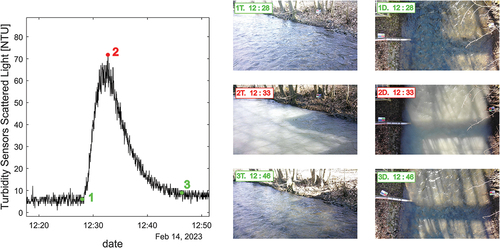
Figure 6. Examples of images taken on the Sarno River at Scafati (Italy) where the presence of suspended material is clearly visible: (a) ordinary condition; (b) dense presence of macroplastic (polystyrene foams) and organic material; (c) presence of plastic elements; (d) presence of foam on the surface.
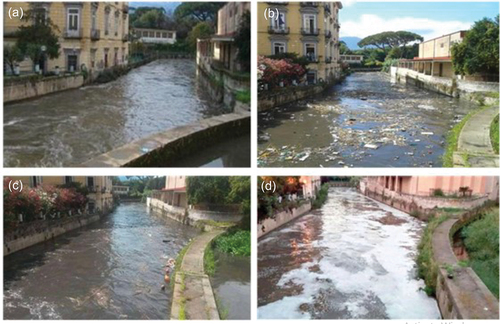
Figure 7. Example of UAS-based imagery obtained with (a) an RGB and (b) a thermal camera at the confluence of the Nocerino River and the Sarno River. The image shows a clear flow of pollutants coming from the right tributary.
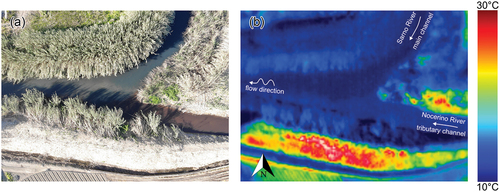
Figure 8. Outlet of the Sarno River: (a) RGB UAS image, (b) normalized difference turbidity index, NDTI = (R − G)/(R + G) obtained as the ratio between the red (R) and green (G) bands.
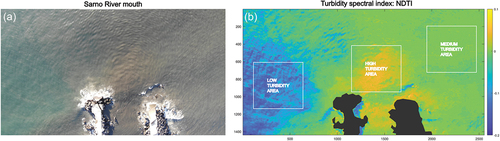
Figure 9. Performance of automatic feature detection for plastic detection applied on five different river locations across Jakarta, Indonesia (taken from van Lieshout et al. Citation2020).
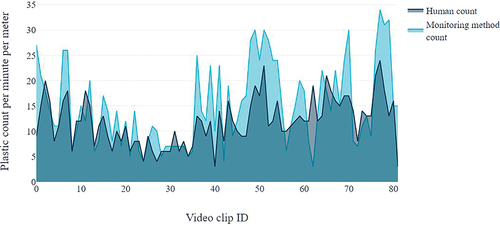
Figure 10. Sample image of floating plastic bottles in the environment, with floating macroplastic processed with the YOLOv7 algorithm.
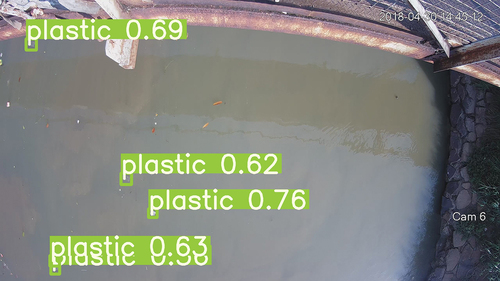
Table 2. Public repositories useful for image-based applications.