Figures & data
Figure 1. Area sown to cotton and cotton yield in South Kazakhstan, 1950–2015.
Source: Statistical Yearbook 50 Years Start of the Virgin Lands Campaign (1953–2002); Azhimetova (Citation2011); data tables published at www.stat.gov.kz. Data between 1960 and 1980 at five-year intervals.
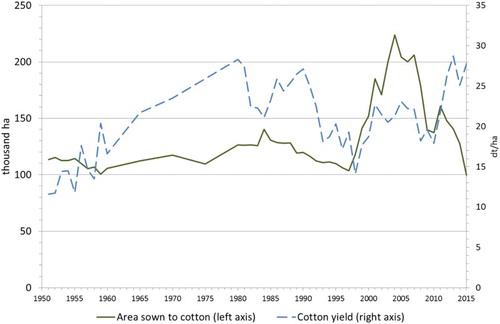
Figure 2. Comparison of world and Kazakhstani farm-gate cotton prices. Source: Agency of Statistics of the Republic of Kazakhstan; National Cotton Council of America.
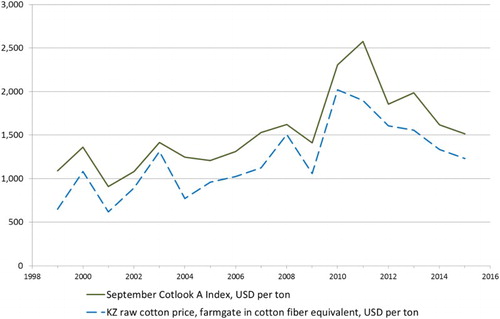
Figure 3. Schematic representation of the cotton supply chain before and after the 2007 legislation.
Source: the authors, based on Sadler (Citation2006, 102).
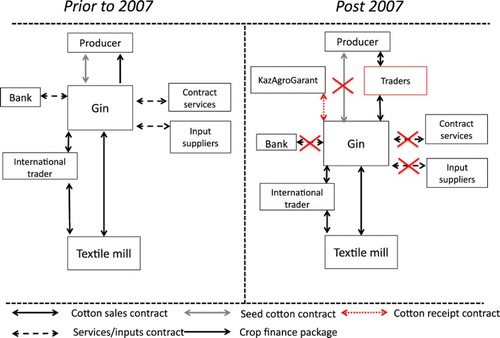
Figure 4. Physical output of agriculture in total and cotton in particular in Kazakhstan, 1990 = 100.
Source: the authors, based on data tables published at www.stat.gov.kz.
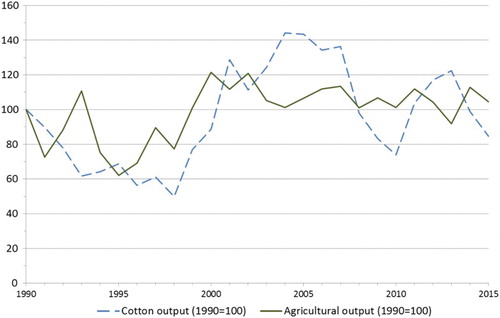
Figure 5. Kazakhstani cotton area and cotton exports and cotton world market price (2007 = 100).
Source: Agency of Statistics of the Republic of Kazakhstan; UN Comtrade (Citation2015) and Cotton Outlook (Citation2015).
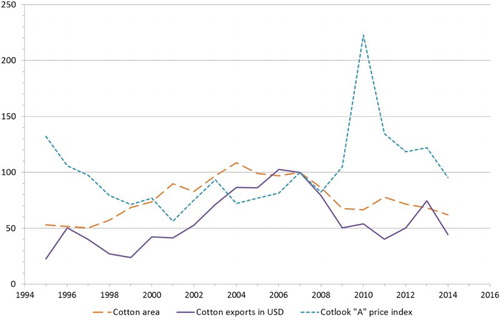
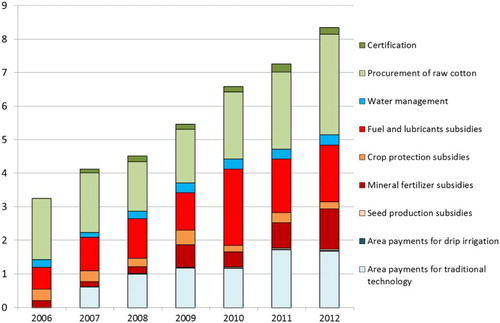
Figure 6. Structure of government support of the cotton sector (KZT billions).
Source: Ministry of Agriculture of the Republic of Kazakhstan (unpublished); OECD (Citation2017).