
Figures & data
Figure 1. Suicide rate trends over time in Azerbaijan, Kazakhstan, Kyrgyzstan, Turkmenistan and Uzbekistan.
Note: The suicide rate in Azerbaijan drops by the end of 1994; after that it sharply increases until 2008, and then declines. The suicide rate in Kazakhstan consistently augments by the end of 2006, and declines after 2006 until 2017. The overall pattern of suicide rates in Kyrgyzstan resembles a parabolic function with large and small peaks. The suicide rate deteriorates by 2003, mitigates between 2003 and 2009, and worsens between 2010 and 2012. The suicide rate in Turkmenistan rises by the end of 2005, and declines in and after 2006. The overall trend of suicide in Uzbekistan fluctuates. It increases sharply between 1993 and 2001, and then fluctuates throughout the rest of the period.
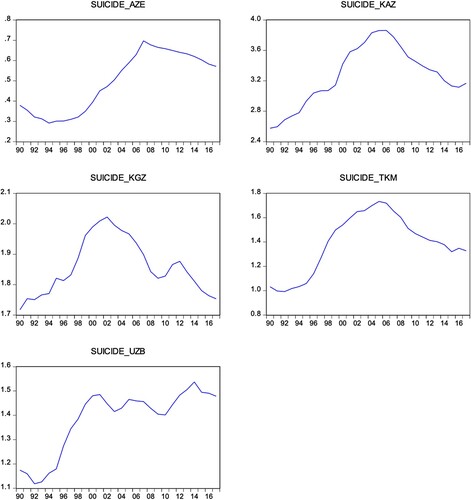
Table 1. Suicide rate data for the period 1990–2017.
Table 2. Frequencies on the justification of suicide from Wave 6 of the World Values Survey.
Table 3. Frequencies on the justification of suicide from Wave 7 of the World Values Survey.
Table 4. Descriptive statistics for each country.
Table 5. Correlation matrix.
Table 6. Cross-section dependence test results.
Table 7. Panel unit root test (H0 assumes individual unit root process).
Table 8. Panel cointegration test (H0: No cointegration and Ha: Some panels are cointegrated).
Table 9. Panel cointegration test (H0: No cointegration and Ha: All panels are cointegrated).
Table 10. Swamy parameter constancy test.
Table 11. Results of long-run coefficient estimations for the model in equation (1).
Table 12. Results of long-run coefficient estimations for the model in equation (2).
Table 13. Results of long-run coefficient estimations for the model in equation (3).
Table 14. Pairwise granger causality tests.