Figures & data
Table 1. Teaching sequence
Table 2. Description of the sequence
Figure 1. Average of the responses provided by the participants for each category (showed in ) of the questionnaire KPSI (‘how much’ they knew before and after experiencing the teaching sequence)
Figure 2. Evolution in the average of the responses provided by the participants for each category (showed in ) of the questionnaire KPSI (‘how much’ they knew before and after experiencing the teaching sequence)
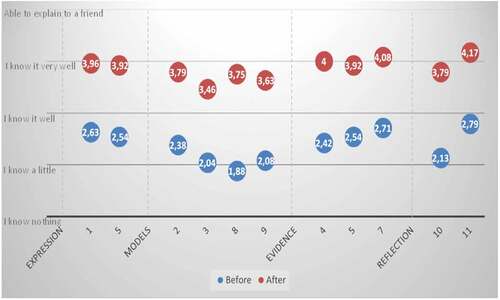
Figure 3. Emotions experienced by the participants
Figure 4. Participants’ perceptions about the importance of using models in scientific practices before and after implementing the teaching sequence