
Figures & data
Figure 1. Scientific thinking and its sub-competences, competence-aspects as well as influencing factors (Arnold et al. Citation2018; Mayer Citation2007).
Figure 2. Exemplary concept cartoon ‘Why do we need a hypothesis?’ (Arnold, Kremer, and Mayer Citation2017; translated).
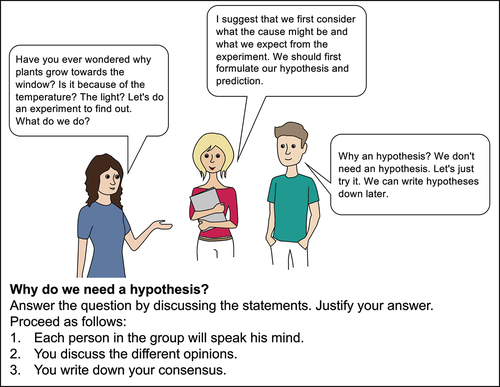
Table 1. Coding manual for concept cartoon ‘Why do we need a hypothesis?’.
Table 2. Concept cartoon-questions (Arnold Citation2015; Arnold, Kremer, and Mayer Citation2016).
Table 3. Ideas of procedural understanding, abbreviations, and matching quality criteria.
Figure 3. Concept cartoon ‘Why do we need a hypothesis?’ with rating scale.
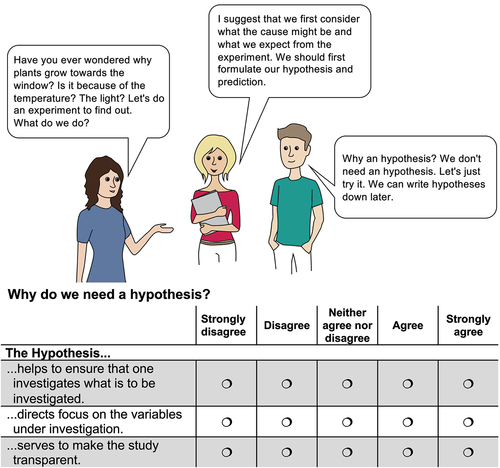
Figure 4. Percentage of the agreement to concept-cartoon-items (the bars represent the combined ‘strongly agree’ and ‘agree’ answers).
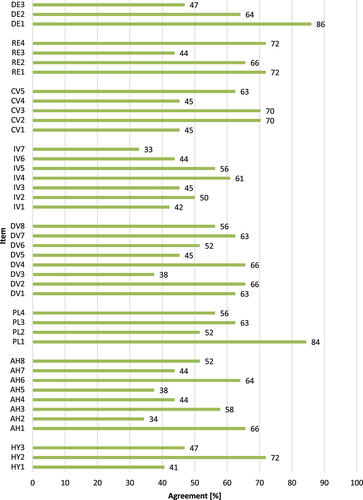
Figure 5. Significant correlations (p < .05) between the ideas of procedural understanding (Arnold, Kremer & Mühling, Citation2017).
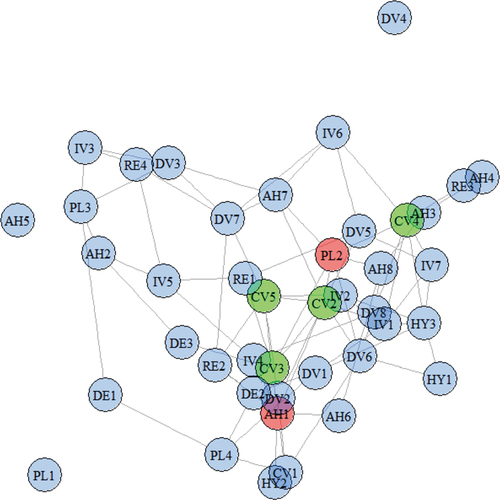
Table 4. Concepts that differentiate good from bad performers on the procedural-understanding-test (p < .05).