
Figures & data
Table 1. Frequency of participants’ responses and mean scores on knowledge about microorganisms.
Figure 1. Distribution of the summative test scores.
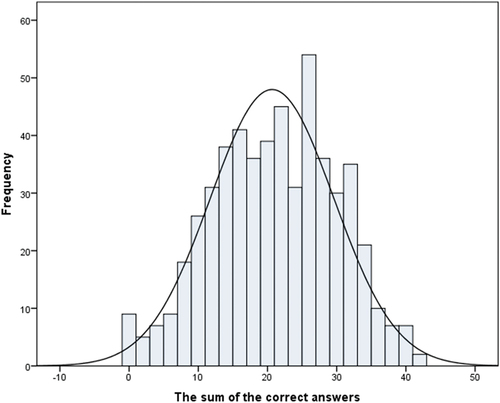
Table 2. Frequency of participants’ responses and mean scores for attitudes towards microorganisms.
Table 3. Rotated component matrix of participants’ opinions.
Supplemental material