Figures & data
Figure 1. Timeline for deployment of the SRL questionnaire and knowledge survey to a cohort of first-year agriculture students (n = 213) enrolled in a core agricultural science subject in semester 1, 2018. Details of periods for collection of Australian Tertiary Admissions Rank (ATAR) and average semester mark shown.
Table 1. Details of study strategies used by students to aid learning in higher education with samples from the short-answer component of the SRL questionnaire.
Table 2. Proportion of students who (A) reported strategies as being most effective in aiding their learning and (B) intended on changing strategies for future assessment at the end of semester 1, 2018 (T2) and at start semester 2, 2020 (T3).
Table 3. Results of mixed linear modelling of changes between subscale scores at the start of semester 1 2018 (T1), end semester 1 2018 (T2) and start semester 2 2020 (T3) with Tukey’s Multiple comparisons with details of Cronbach’s alpha coefficients for survey subscales and knowledge survey. Little’s Missing Completely At Random (MCAR) test results and Chi-squared matching between timepoints shown.
Figure 2. Scores for self-efficacy (a) and learning strategies (b) subscales on the SRL questionnaire deployed to students at the start (T1) (n = 163) and end (T2) (n = 147) of semester 1, 2018, and at the start of semester 2, 2020 (T3) (n = 46). All questionnaire items assessed on a 5-point scale (1 = not at all true of me, 5 = very true of me). Mixed linear model with Tukey’s multiple comparisons used, comparing pairwise mean differences between scores at each timepoint, *p < 0.05, **p < 0.01. Means (solid lines) ± SD (dotted lines). All p-values presented in .
Figure 3. Regression of average mark for semester 1, 2018 and semester 1, 2020 with Australian Tertiary Admissions Rank (ATAR) (a) (n = 120, 2018; n = 105, 2020), knowledge score (b) (n = 124, 2018; n = 105, 2020), self-efficacy (c) and learning strategies (d) (both: n = 108, 2018; n = 35, 2020). Knowledge scores from start semester 1 2018 (T1 only) assessed confidence in scientific material on a 3-point scale (1 = I don’t feel confident I could answer this question, 3 = I feel confident I could answer the question). Self-efficacy and learning strategies subscales assessed on a 5-point scale (1 = not at all true of me, 5 = very true of me). Significantly non-zero correlations at p < 0.05. All p-values and R2 values presented in .
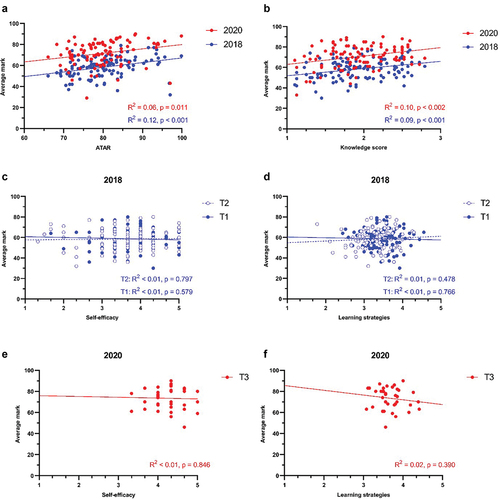
Table 4. Results of regression of variables Australian Tertiary Admissions Rank (ATAR), knowledge score and ‘Self-efficacy and ‘Learning strategies’ subscale scores against average mark for semester 1 2018 and semester 1 2020. Regression of normalised change in subscale scores between start semester 1, 2020 (T1) and start semester 2, 2020 (T3) against normalised change in average mark also shown.
Figure 4. Regression of normalised change in average mark between semester 1, 2018 and semester 2, 2020 with normalised change in self-efficacy (a) (n = 18) and learning strategies (b) (both n = 22) subscales between T1 and T3. Normalised change scores range from −1 to +1, with a score of +1 indicating the maximum possible gain. Four students with maximum score (score = 5) at T1 for self-efficacy were excluded from the analysis. Significantly non-zero correlations at p < 0.05. All p-values and R2 values presented in .